


Spotlight
The remarkable story of an overlooked map archive that reveals how maps have helped inspire some of the greatest scientific discoveries, but also led to terrible atrocities.
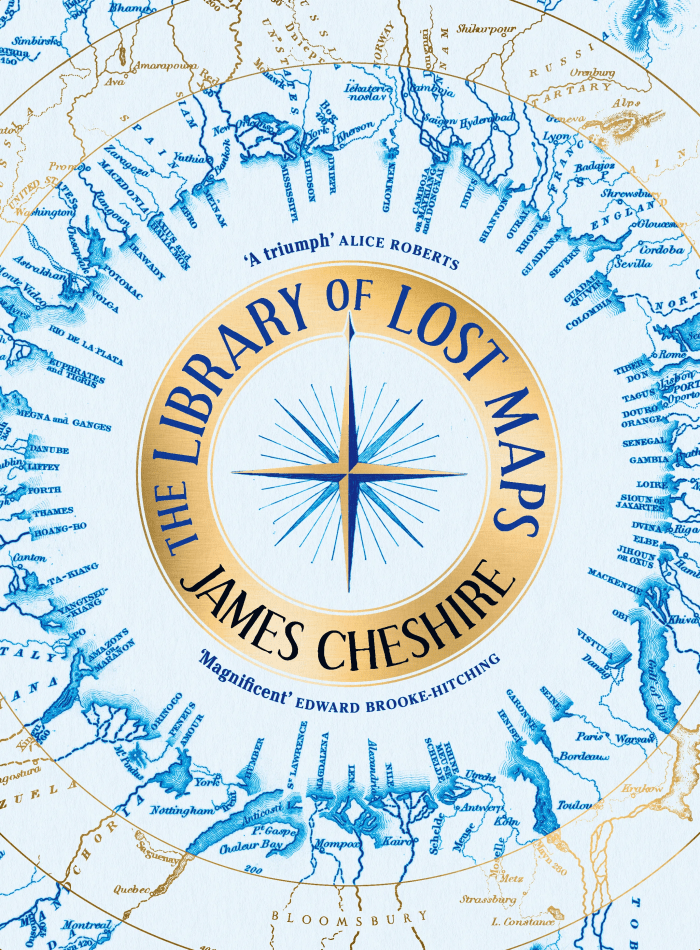
The remarkable story of an overlooked map archive that reveals how maps have helped inspire some of the greatest scientific discoveries, but also led to terrible atrocities.