James Cheshire
About
Blog
Teaching
Papers
Category:
London
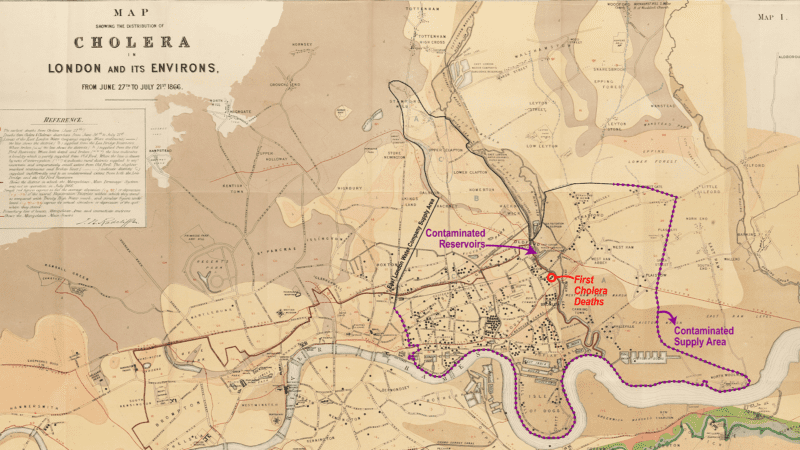
The long history of using maps to hold water companies to account
Oct 8, 2022
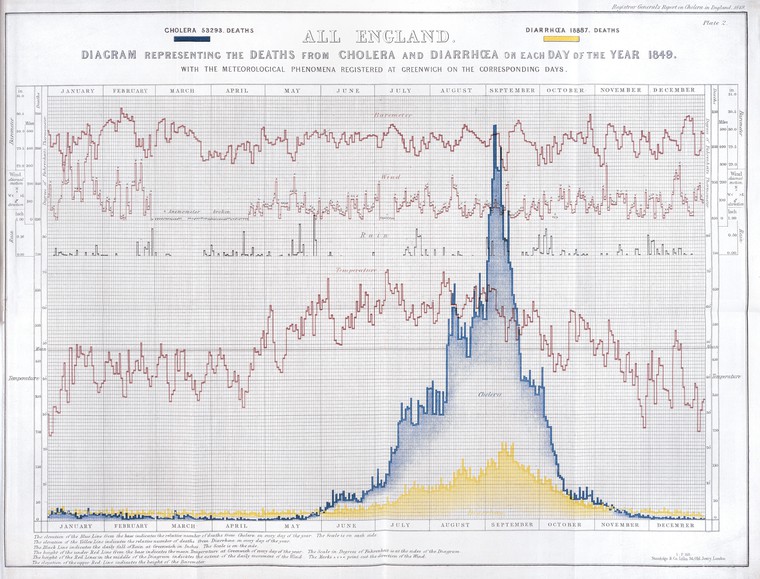
How the Victorians Mapped London’s Cholera
Mar 2, 2019
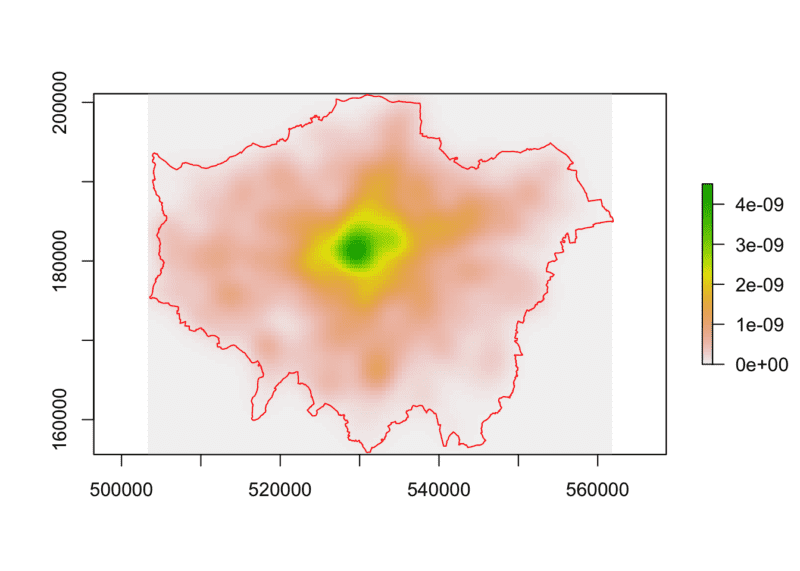
Point Pattern Analysis using Ecological Methods in R
Dec 12, 2017
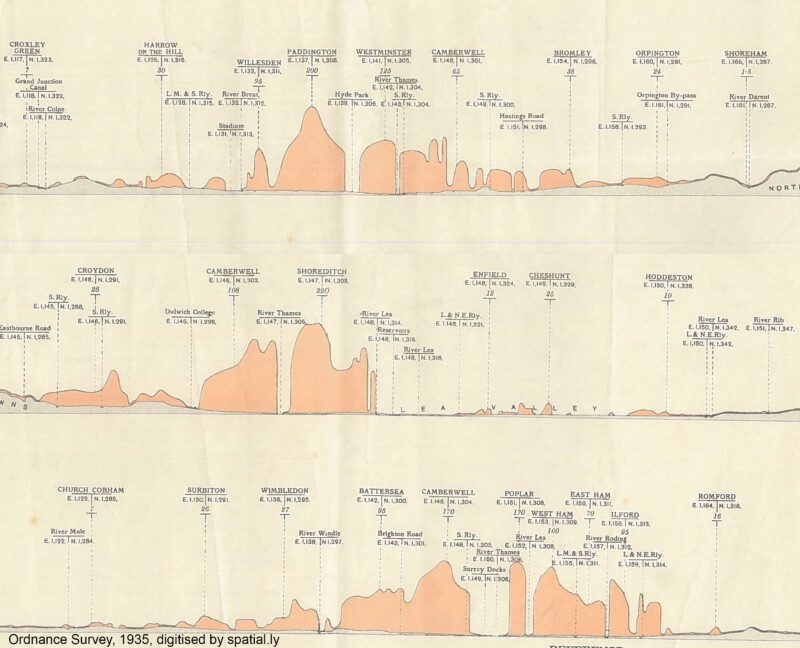
London's Population Profile in 1935
Nov 10, 2017
The Power of Print
Sep 6, 2016
London As You've Never Seen it Before…
Sep 6, 2016
London: The Open Data Capital
Dec 5, 2014
Improving R Data Visualisations Through Design
Nov 6, 2014
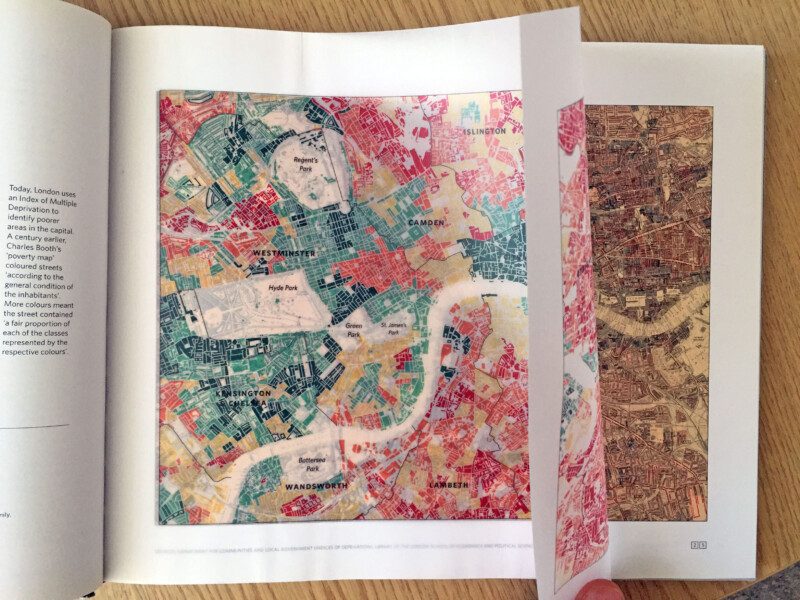
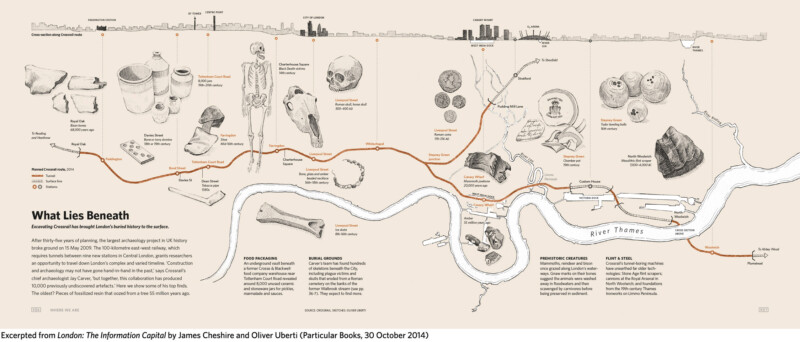
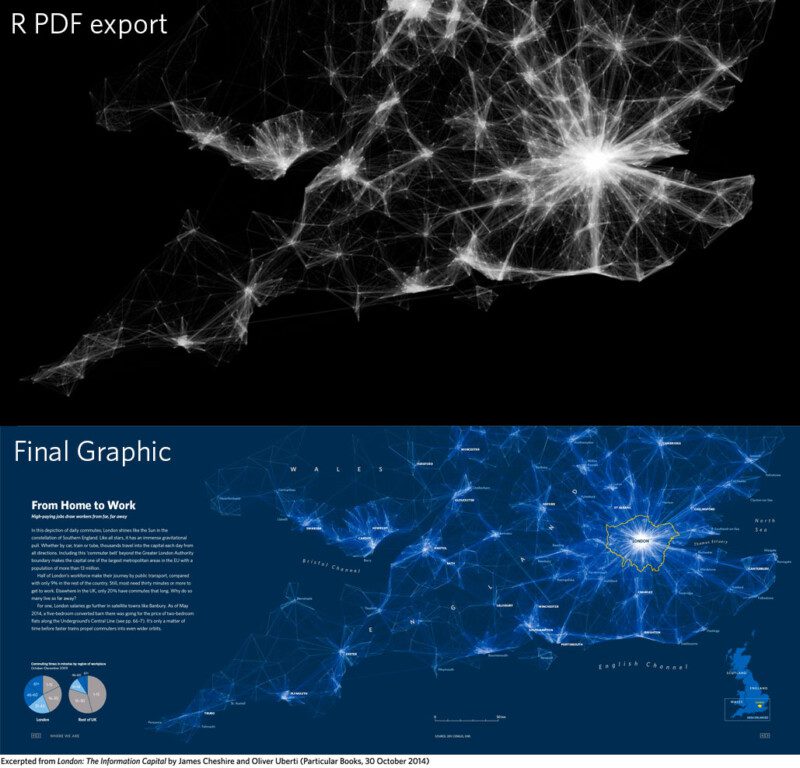
London: The Information Capital
Sep 30, 2014
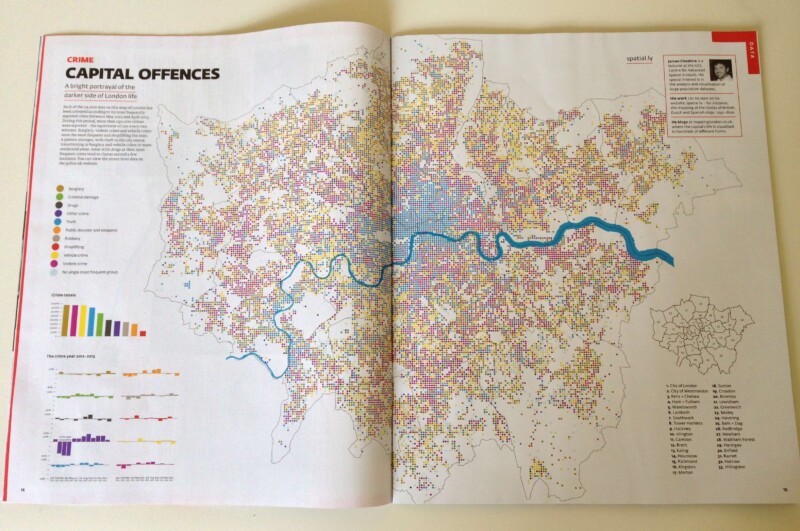
Crime Map of London
Jul 27, 2013
1
2
3
Next Page