
This has been cross-posted from a guest blog post I wrote on the London Datastore.
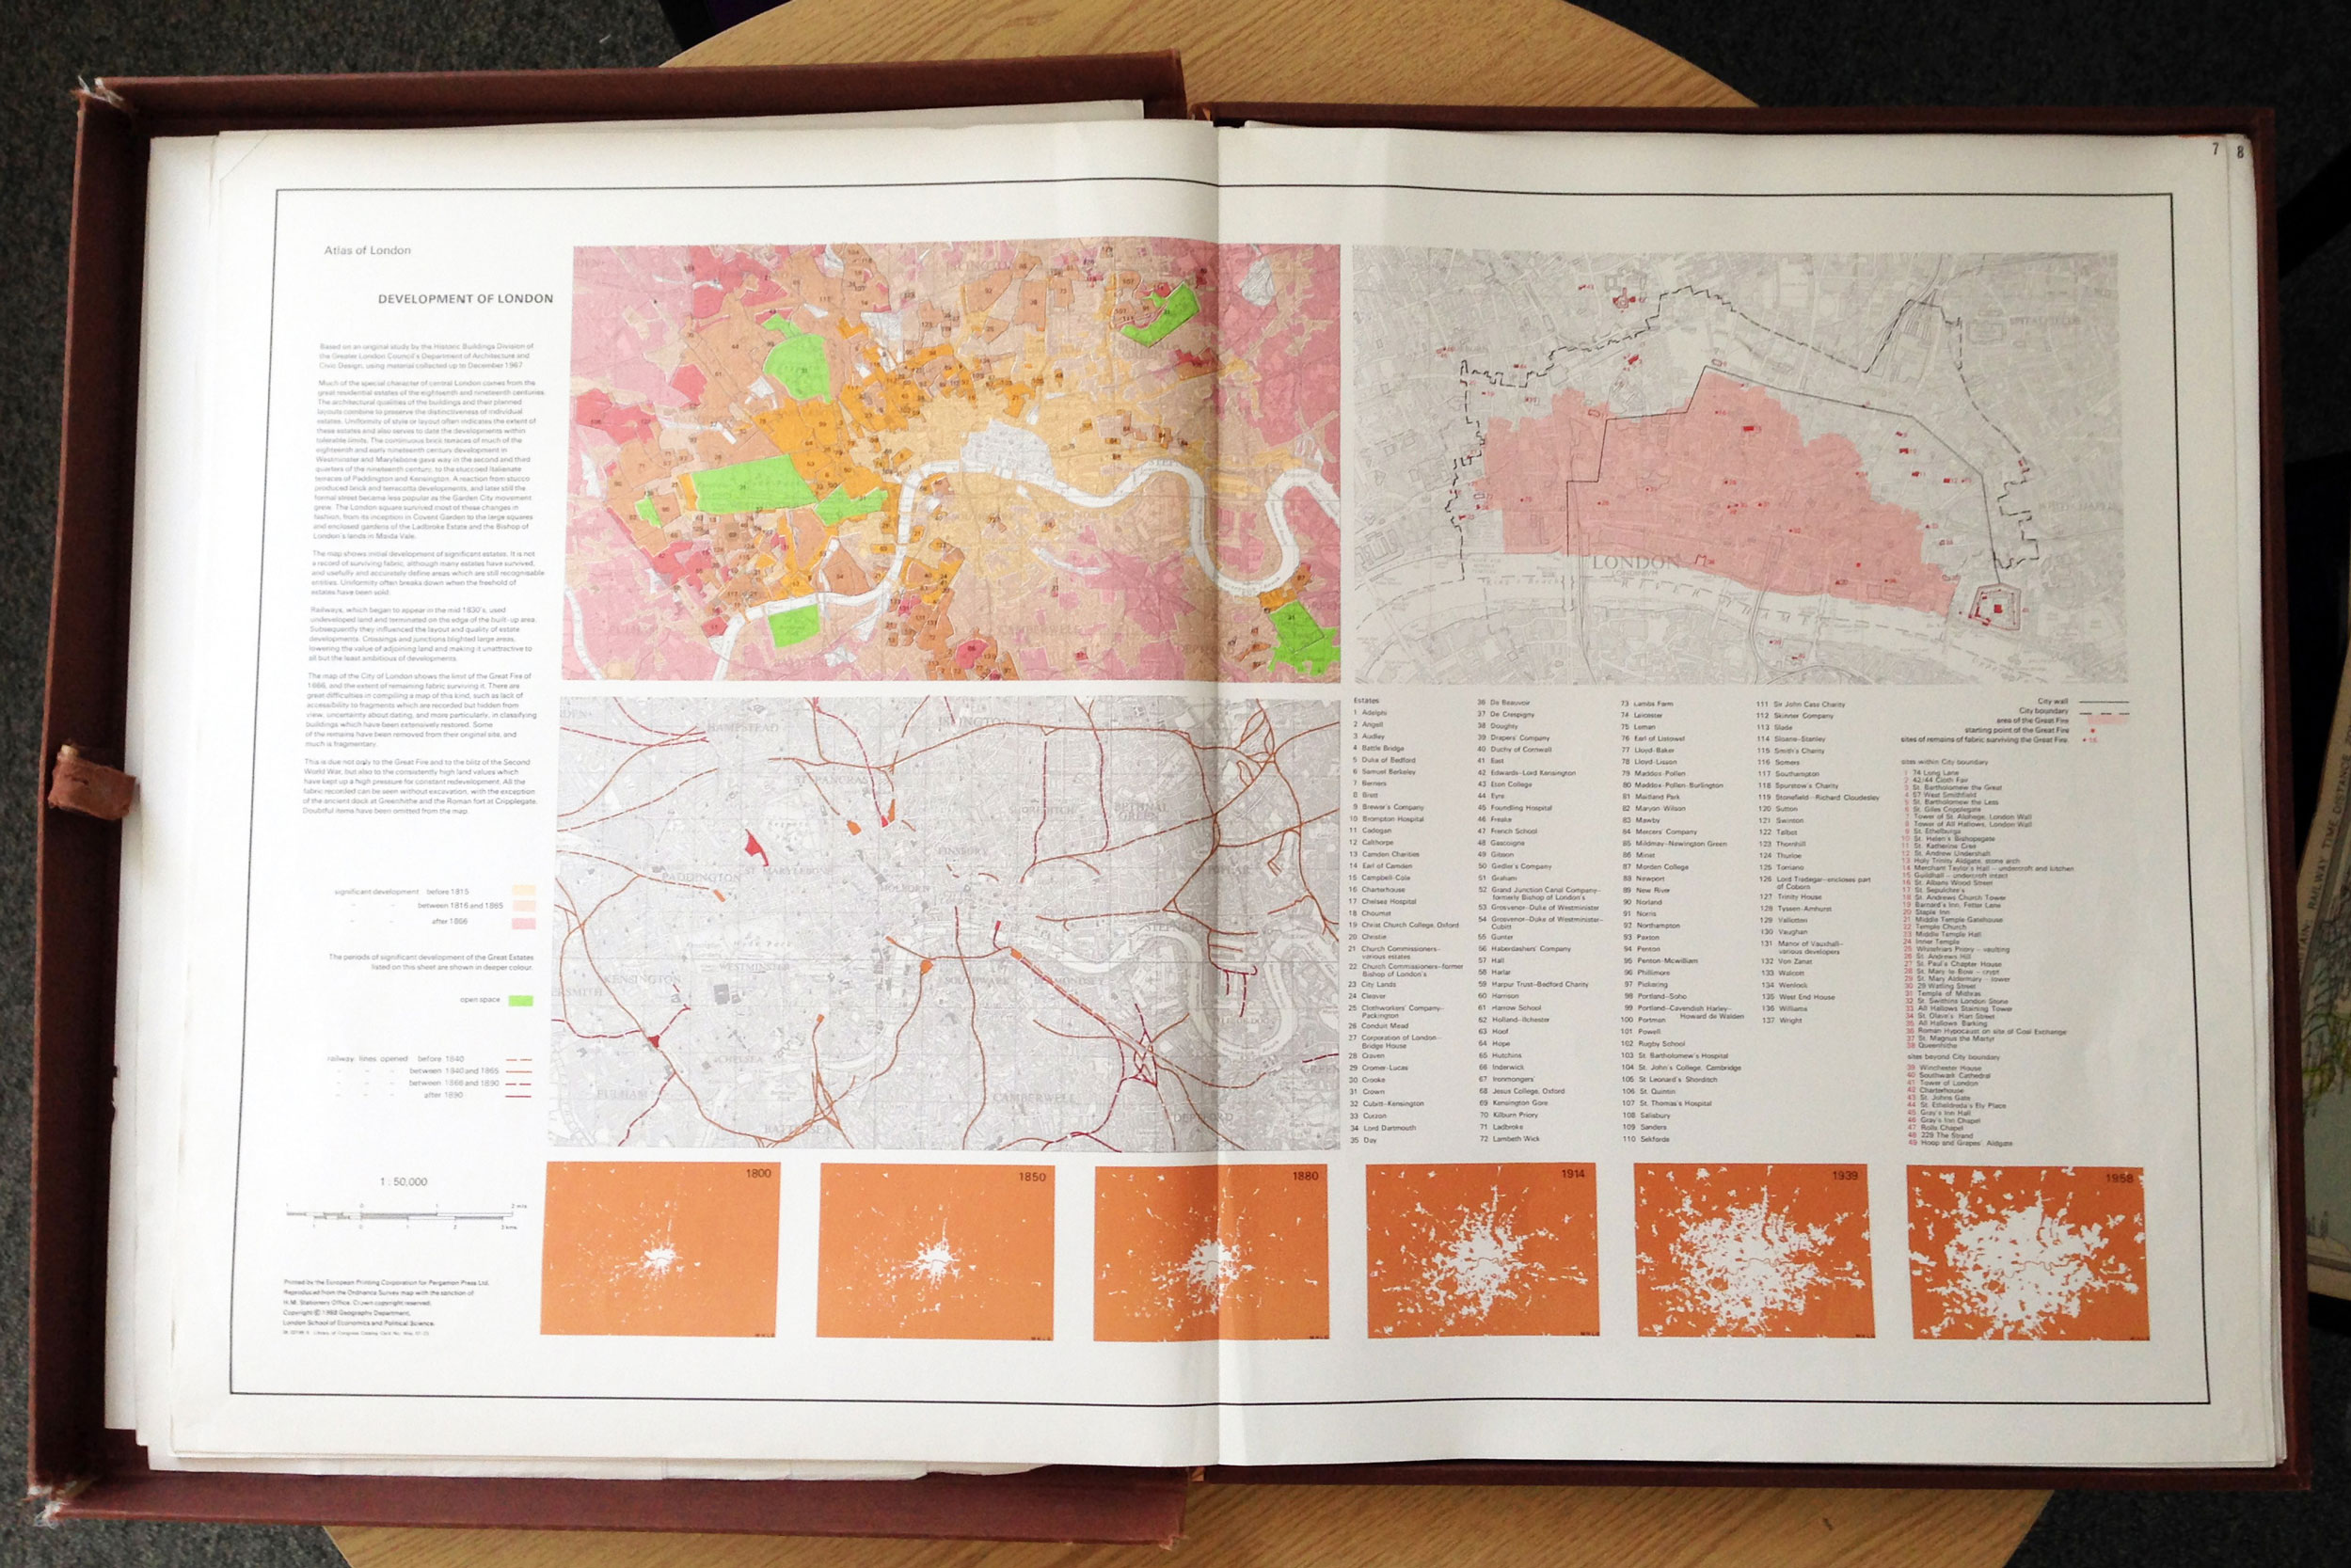
Throughout London’s history, its data have inspired innovative maps and visualisations from the likes of John Snow, William Farr, Charles Booth and Florence Nightingale, all of whom were truly pioneering in their communication of complex datasets throughout the 19th Century. A more recent and less well-known contribution to their legacy is the “Atlas of London and the London Region”, which takes pride of place in my office. Published in 1968 by Emrys Jones and Daniel Sinclair, it is a box containing 70 maps – each nearly a metre wide – that depict everything from London’s topography to the growth of the city and its overcrowded households. The atlas was six years in the making and the work required to produce it without widespread digital mapping tools must have been enormous.
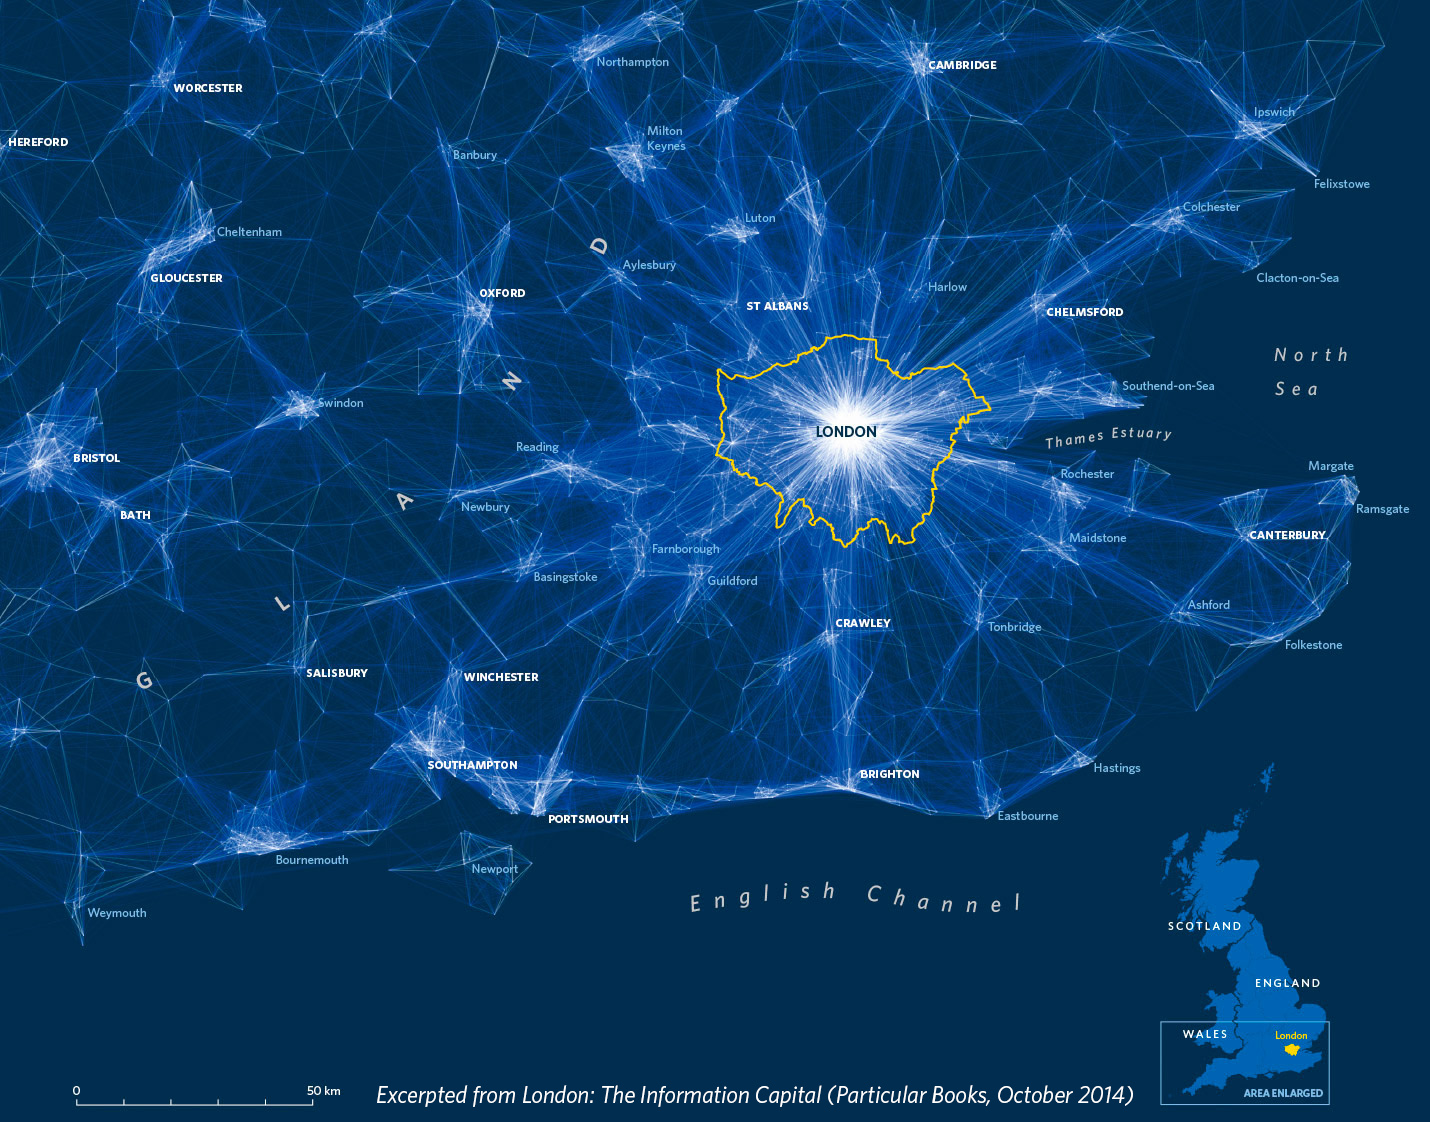
Inspired by London’s visualisation pioneers London: The Information Capital is a new book that I produced with designer Oliver Uberti. Although it is more modest in terms of its physical dimensions, its 20 million data points are a reflection of a wealth of data that simply did not exist in Jones and Sinclair’s day. The variety of topics that Oliver and I were able to explore – from commuter flows to Londoners’ binge drinking habits – is the result of the volume of freely available data covering all aspects of London life. For example, we had easy access to everything from the UK’s 2011 Census to Transport for London performance data and Ambulance call-outs. London: The Information Capital benefitted not just from their existence but also from the easy-to-analyse format in which they are shared.
Open data initiatives now exist in other cities, but London continues to be a pioneer in the creation and dissemination of its data, to the advantage of those who live here. Indeed, the volume of data made freely available, supplemented by the likes of social media and those obtainable through Freedom of Information requests (FOIs), inspired the book’s title. By saying that London is the Information Capital we are challenging other cities to match the great work conducted by the likes of the London Datastore.
We are not suggesting London has done all it can to improve access to data. Many more datasets could be made open, while others could be made easier to find among the lists of files.
Moreover, datasets in their raw form require high-level skills to turn them into usable information: in this sense, increasing data provision is by no means the same as increasing data access. That said, moves to increased accessibility are already being made, with the likes of “dashboards” offering accessible snapshots to key trends in the data behind them and interactive maps that can show patterns without the need for number crunching. By offering a series of new data portraits, we hope that London: The Information Capital adds to these developments and offers some new perspectives on an old city.