COVID inquiry heard Boris Johnson ‘struggled’ with graphs – if you do too, here are some tips

James Cheshire, UCL and Rob Davidson, UCL

In March 2020, the UK government’s chief scientific adviser, Patrick Vallance, presented to the nation a graph showing “the shape of an epidemic”. The red line depicting the number of predicted COVID cases rose to a steep peak before falling again. Vallance explained that delaying and reducing the height of that peak was essential to ease the strain on Britain’s healthcare system. Boris Johnson, then prime minister, put it much more succinctly: “Squash that sombrero.”

In the two years that followed, both men must have spent many hours discussing graphs like this. But as we’re now learning through Vallance’s testimony in the COVID inquiry, it seems the prime minister struggled to understand what was shown in these graphs, despite his daily exposure to them.

Inquiry chair Baroness Hallet spoke up for the former prime minister: “He wouldn’t be the only person to struggle with graphs. I confess to struggling with graphs myself on occasion.”

Her point is an important one: communication is a two-way street. It’s not always fair to blame the person looking at a graph if they misunderstand it, it must be made intelligible in the first place.

During the inquiry, much has been made of the need for policymakers to grasp basic statistics in order to make informed decisions, especially when the stakes are high. So how can scientists create better data visualisations to help solve this problem?

To find the answer to this, we can look back 160 years to Florence Nightingale, namesake of the temporary hospitals created in the early days of the pandemic. Nightingale was a pioneer of using effective data graphics to change policies during a time of crisis.

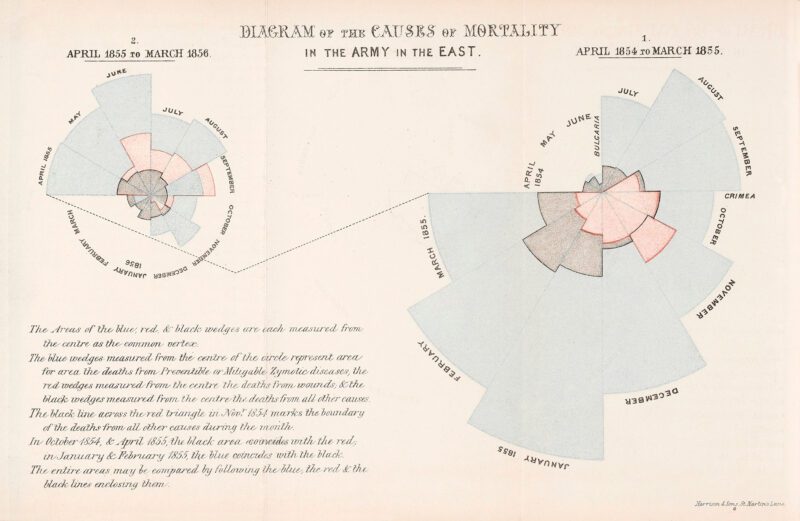
Following her experience nursing soldiers dying from preventable diseases in the Crimean war (1853-1856), she waged her own battle against the British military. To convince them of the need for sanitary reform, Nightingale worked with other statisticians to create graphs that were sent out to key establishment figures, including Queen Victoria, with Nightingale hoping “she may look at it because it has pictures”.

A chart from 1858 showing multicoloured wedge graphs depicting the causes of mortality in the British Army, with deaths from preventable or mitigatable diseases far outstripping those from wounds and other causes.
Florence Nightingale’s charts are a model for science communicators. Wellcome Collection

Her charts visually separated the stats on monthly deaths before and after sanitary reform, and showed how few deaths were caused by the wounds of battle. Nightingale left readers in no doubt that poor living conditions were killing soldiers in their barracks. This inspired reforms that saved countless soldiers from dying from preventable diseases.

How scientists can better communicate data

Since Nightingale’s time, there has been a great deal of progress in the use of statistics to improve public health. Here are two very simple improvements to charts that can make a huge difference to their readers: better colours and more considered use of text.

An entry in Vallance’s notebook details Johnson’s confusion over the colours in a line graph. Scientists can be prone to using unclear colours in their visualisations. Colour choice has been shown to affect how accurately users read maps, with recent research suggesting it can be confusing to use “cheery” colours to visualise grim data.

There are many guides on how to avoid poor colour choices hindering important decisions or making data inaccessible to people with colour blindness.

Vallance told the inquiry he was also concerned that Johnson was not retaining messages from the graphs. Very little can be done if the audience is not paying attention, but a 2016 study found that people were more likely to remember the message of a visualisation if it contained titles and annotations that spelled out information already shown in the graphic.

Time is of the essence, since readers can form their impression of a graphic within 500 milliseconds. Alan Smith, head of visual and data journalism at the Financial Times, encourages his team to use active verbs in their titles. As he writes in his book How Charts Work, this approach will “give a chart focus, providing a real narrative sense of purpose”. https://www.youtube.com/embed/2moJvFVM50M?wmode=transparent&start=0

How you can be a better graph reader

There are also things that we, as readers, can do to better understand the graphs, charts and data visualisations that are part of daily life. Here are a few things to look out for.

Some charts can mislead by being selective in the values used on their axes. A common trick – which politicians have mastered – is that they don’t start at zero in order to exaggerate an increase or decrease in something. There may be good reasons for this approach, but not always.

You should also look out for a source, and confirm that it’s a reputable one such as the Office for National Statistics. If the source isn’t shown, ask. If there is no credit at all, then you are right to be sceptical.

Finally, be just as curious about what the graph doesn’t show. Is there data missing, or does the plot only show one aspect of a problem? Do other charts of the same data show something different?

Often there are no perfect answers to these questions. But they are important conversation starters – especially if, like Vallance and Johnson, the person who can explain the graph is right in front of you.

James Cheshire, Professor of Geographic Information and Cartography, UCL and Rob Davidson, Postgraduate Researcher in Human Geography, UCL

This article is republished from The Conversation under a Creative Commons license. Read the original article.

The era of the megalopolis: how the world’s cities are merging

James Cheshire, UCL and Michael Batty, UCL

On November 15 2022, a baby girl named Vinice Mabansag, born at Dr Jose Fabella Memorial Hospital in Manila, Philippines, became – symbolically – the eight billionth person in the world. Of those 8 billion people, 60% live in a town or city. By the end of the 21st century, cities will account for 85% of Earth’s predicted 10 billion inhabitants.

Cities don’t only grow by the number of inhabitants. The more people they host, the more services (public transport, energy infrastructure, water supply) they need, the more governance they require and the more resilient their economy has to be. It might be surprising then to learn that there is no single definition of what a city actually is.

In medieval times, cities from London to Seoul were delineated by their walls. And even well into the 20th century, the idea of a city’s limits still held water. Today, if the process of urbanisation still brings to mind the biggest pre-millennial metropolises (Tokyo, São Paulo, New York or Mumbai), they represent nonetheless a decreasing proportion of all the world’s cities.

A view of high-rise buildings with afternoon sunlight.
New York represents the city of the 20th century. Ben O’Bro | Unsplash

By contrast, in the more rapidly growing urban centres, such as Lagos, the geographic extent of a mayor’s official jurisdiction often ends long before the populace it serves does. Its economy, meanwhile, is often deeply intertwined with those of the neighbouring cities.

The question of where to draw the line between what is and what is not a city – not to mention where one ends and another begins – is getting harder to answer. As the world moves towards total urbanisation, settlements are spreading out by merging into one another to create what urban experts term “megalopolises”.

How machines saw cities grow

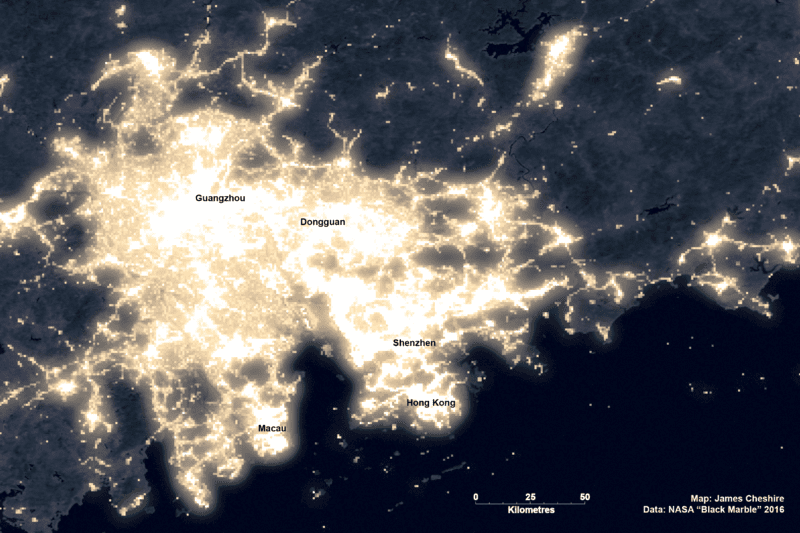
The largest of these mega-cities already exceeds 60 million people. In China, the region of Guangdong province around the Pearl River estuary now known as the Greater Bay Area effectively merges 11 cities, from Macao all the way around to Guangzhou, Shenzhen and Hong Kong.

With a total population of over 70 million inhabitants, it counts 2 million more people than the entire population of the UK, squeezed into roughly a fifth of the area. In economic terms, it looms just as large: at US$1.64 trillion (£1.39 trillion) in 2018, its GDP represents 11.6% of China’s total.

A map of light emissions beaming from the Guangdong-Hong Kong megalopolis. James Cheshire, Author provided

On the west African coast, meanwhile, the 600km stretch between Abidjan, Ivory Coast and Lagos, in Nigeria, is rapidly catching up. Experts predict that by 2100, this agglomeration of nine cities will be the most densely populated on earth, with up to 500 million people.

Cities only really started growing in the mid-18th century when we began to build machines that would propel us much faster – and further – than any technology invented so far. For the first time, cities and London, in particular, broke through the threshold of around 1 million people in size that had dominated the urban world hitherto.

Some cities, including Chicago and New York, grew upwards as the technologies of the steel frame and the elevator enabled those with the resources to erect the early skyscrapers, those “cathedrals of commerce”.

With the invention of the automobile, many cities, such as Los Angeles, have grown outwards, despite widespread resistance to the idea of urban sprawl.

Some large cities in the developing world including Dar es Salaam in Tanzania or Nairobi in Kenya have grown inwards. Here, the idea of the compact city based around public transport and higher residential densities has taken root.

A bird's eye view of a sprawling cityscape.
The gridded urban sprawl of Los Angles, California. Yuxuan Wang | Unsplash

How the metaverse is redefining the city

Most people today live in medium-sized or even small cities. We still largely depend on the internal combustion engine to move between different activities, typically home and work.

However, over the last 50 years, the advent of computers and networked communications has meant that people can now live at huge distances from their colleagues. This blurs the physical boundaries of any city.

Counting a city’s inhabitants and mapping its geographical boundaries are only some of the aspects to consider when defining what a city is. The digital skin that now covers the planet enables the citizens of any city to interact with anyone and everyone, in any place, at any time.

Cities will continue to grow and change physically. By the end of the 21st century, every place will no doubt be one form of city, but the term itself is not likely to disappear. Instead, its meaning will change.

In 1937 already, in a compendium entitled The City Reader, the historian Lewis Mumford argued that although cities might be identified as physical entities, they were places of social interaction, of communications.

This resonates strongly with the notion that in the future we will no longer think of cities simply as distinct physical hubs in a rural landscape but as patterns of digital movement, crisscrossing the planet over many scales from the mega city down to the local neighbourhood. Boundaries will no longer have the same meaning as they did before the first industrial revolution in Britain in 1830.

The West African megalopolis stretches from Lago in Nigeria to Abidjan in Ivory Coast. James Cheshire, Author provided

Scholars agree that as cities get bigger, they generate economies of scale that increasingly dominate their economic growth and prosperity. Evidence suggests that the urban world is even more complex.

Cities increasingly resemble biological systems more than they do mechanical systems, with transportation networks reaching out into the hinterlands around them resembling arboreal fractals.

The emerging urban world is vastly different from anything that has gone before. Trying to determine the physical limits of the city remains important. In figuring out how to reckon with this new complexity, however, it may well be too superficial.

This article is republished from The Conversation under a Creative Commons license. Read the original article.

The long history of using maps to hold water companies to account

Surfers Against Sewage

James Cheshire, UCL

Southern Water was handed a record fine of £90 million in July 2021 after pleading guilty to illegally discharging sewage along the rivers and coastline of Kent, Hampshire and Sussex. More than a year later, the headlines have not improved for Britain’s embattled water companies who have recently discharged more sewage close to dozens of beaches.

The Environment Agency has called on water company executives to face jail due to the ongoing failings on environmental performance. And with the onset of drought, complaints about leaky water pipes have gone from a trickle to a stream.

Maps by conservation organisation The Rivers Trust and campaign group Surfers Against Sewage lay bare the extent of sewage dumping into rivers and the sea. They have proved to be a highly effective tool, not just to warn of the risks to bathers but also to provide evidence of environmental damage.

Two annotated maps of SE England
Recent sewage dumps in rivers (left) and along the coast (right) in south east England. The Rivers Trust (left) and Surfers Against Sewage (right)

These maps pull together data from sensors along the sewage network that detect discharges, making it clear where the worst offenders are and encouraging users to contact their local MP requesting more rapid action on sewage discharge. They are easy to share on social media and on local news sites, they have inspired viral tweets and they make for awkward viewing for the water companies themselves.

This is not the first time maps have been used to hold private water companies to account. Some of the most famous maps of mid-19th century London, when it was gripped by successive outbreaks of cholera, helped reveal the cause of the deadly illness and identify the water companies responsible.

Deadly supply

John Snow was a renowned physician who walked the streets of London during the 1854 cholera epidemic, recording the deaths in grim detail. He mapped the cases, revealing clusters around a communal water pump in Broad Street, Soho, which confirmed his theory that cholera came from dirty water. He duly removed the pump handle, the outbreak in that area stopped and the rest – as they say – is history.

annotated map of Soho
Snow’s map showed cholera cases were clustered around a water pump. John Snow / Wellcome Collection

At least, that’s the simple version many people are already familiar with. In fact, the story is much more complex because Snow’s theory that the cholera pathogen was waterborne was not accepted by most scientists or policymakers at the time. He needed more proof. Snow therefore devised a “grand experiment”, which hinged on the way different areas of London were served by different water companies. This meant he could compare one supplier against another in a kind of natural experiment. Snow knew that cases of cholera were not randomly distributed across the city. As he showed in Soho, they tended to be grouped together. So what if some water companies had more cases than others?

Shaded map of London
Snow’s map showed some water companies were safer than others. ‘On the mode of communication of cholera’, John Snow / Wellcome Collection

Snow mapped out where Londoners were being supplied by the Southwark & Vauxhall Company (blue-green) and by the Lambeth Company (red, while brown areas are a mixture of both) during the same epidemic. Lambeth had recently stopped drawing its water from the Thames, which was hugely polluted at the time as it was the main route for sewage to leave London. Its customers were dying from cholera at a rate of 37 per 10,000. Meanwhile, Southwark & Vauxhall was still extracting the polluted water, and their customers were dying at a rate of 317 per 10,000.

This should have proved once and for all that cholera was spreading thanks to foul water supplied into Londoners’ homes. But it wasn’t emphatic enough to trigger decisive change. Worse, a government report in 1856 commended the “considerable improvement which had taken place in the … supply of the water to the Metropolis”.

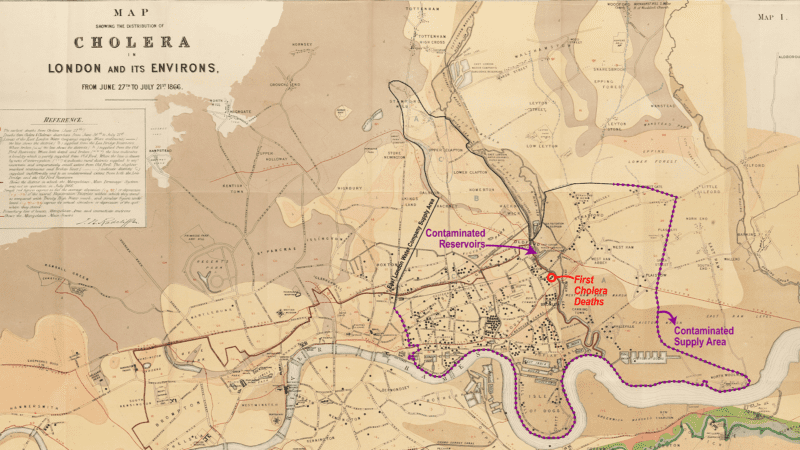
A decade later, and eight years after Snow’s death, London was suffering another cholera outbreak. The man charged with finding its cause during the summer of 1866 was William Farr, a statistician who had criticised Snow’s ideas. Even so, Farr was struck by how concentrated the cases appeared to be in East London and his mind must have turned to Snow’s grand experiment.

Annotated map of London
The 1866 deaths were mostly in the area served by East London Waterworks. William Farr / Wellcome Collection / additional annotations by James Cheshire, CC BY-SA

By mapping the cases, Farr showed that they fitted neatly within the area served by the East London Waterworks Company. Inhabitants of the area were complaining about the quality of their water, with some even finding eels in their pipes. A representative of the company wrote to the Times newspaper reassuring customers that “not a drop of unfiltered water has been supplied”.

Old advert with text
Farr’s work informed public health campaigns in 1866. Wellcome Collection, CC BY-SA

But in his report, Farr found that in July of 1866 water levels were running low so a sluice was opened to allow homes to be supplied by stagnant water from a reservoir that the company had said was no longer in use (because the water within it had not been filtered). Farr was finally convinced that Snow had been right about the origins of cholera, and his map offered irrefutable evidence that East London Waterworks was guilty of supplying water that had caused the deaths of nearly 6,000 Londoners. It was to be London’s last cholera outbreak.

The power of maps

The maps of Snow and Farr were essential for guiding reforms that won better sanitary conditions in the growing city. Today, we live in an era where maps are created from data that they could only dream of, allowing us to see the national picture in real time and pinpoint who is pouring the most effluent into our streams. For the Victorians the fight for safe drinking water was a matter of life and death, but we too can use maps to make the case for a cleaner environment.

As I look at today’s maps of sewage discharges I can’t help but think of a letter the influential scientist Michael Faraday wrote to the Times in the summer of 1855, where he sets out his concerns about the dire state of the Thames after a boat trip along it:

I have thought it a duty to record these facts, that they may be brought to the attention of those who exercise power or have responsibility in relation to the condition of our river … If we neglect this subject, we cannot expect to do so with impunity; nor ought we to be surprised if, ‘ere many years are over, a hot season give us sad proof of the folly of our carelessness.

James Cheshire, Professor of Geographic Information and Cartography, UCL

This article is republished from The Conversation under a Creative Commons license. Read the original article.

The Scarred Landscape of the Climate Crisis

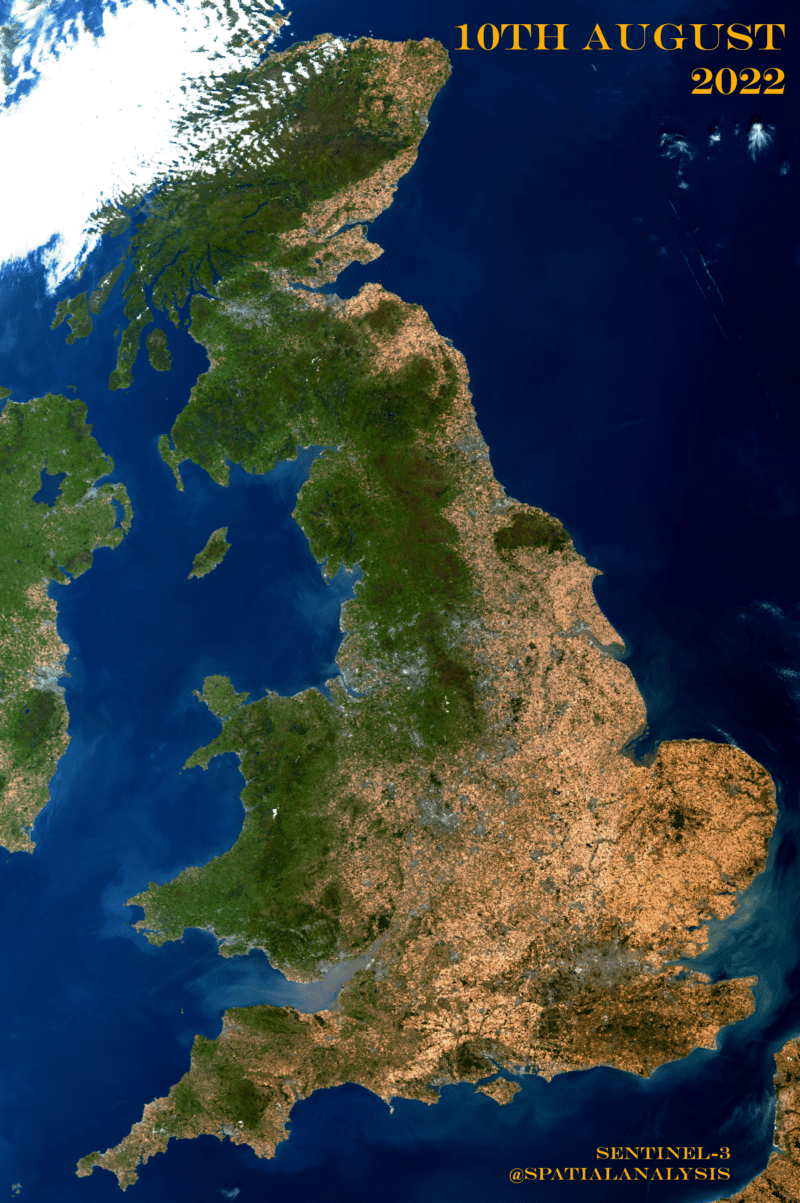
I’ve been obsessively checking satellite imagery to witness the UK turn from green to yellow, thanks to the period of extreme heat and lack of rain Europe has been enduring. The parched landscape is unlike anything I’ve seen before and a cloud free day today (10th August) has revealed the true extent of the drought.

Its shows with extraordinary clarity where the UK gets the most rain (and where some has fallen) thanks to being more to the west or at higher elevations.

The South East has gone from green to yellow and now almost black such is the intensity of the drought. With no significant rain in the forecast and more intense heat in the coming days, its an image that is only going to get more shocking as the summer wears on.

To see and download these images click here.

There’s also a range of educational materials about the climate crisis here.

Footnote: Aren’t crops yellow this time of year?

A field in Kent from a couple of weeks ago, I was looking towards the Isle of Grain.

Yes! Of course they are! And there is a distinct geography to the pattern of agriculture that makes the parts that grow crops such as wheat more ‘yellow’ than others, especially to the South and East. Here’s a nice map from Natural England that shows the land uses that can contribute to the different colours we might see in England.

Source: Natural England Living England Habitat Probability map

But we’ve had the driest July since 1935, so areas that would hold out as green for most of the summer have now become tinder dry. The rainfall map from the Met Office lines up very well with the most parched areas.

…and finally I went back to the last spell of record breaking weather – August 2020 – and processed the satellite image from the same time (7th August) in the same way as the one above. Here you can see the difference. So even by the standards of previous years of extreme heat, our ‘green and pleasant land’ is looking scorched.

Data Source.
Data Source.

Newspapers and the 1976 Drought

With each new temperature record that tumbles the UK, climate skeptics have a standard stock phrase: ‘it was this hot in 1976’. Of course it wasn’t, and crucially the planet overall was not as hot then as it is now. Parts of the UK media have had their part to play in fueling skepticism about the seriousness of the situation and I was struck by how quickly the headlines changed from ‘how bad can it be?’ to ‘this is really serious’ as temperature records tumbled and fires began to rage.

It got me thinking about a map I had spotted within the Atlas of Drought in Britain 1975-1976 – a book I’d happened upon in the UCL Geography map library.

Amongst the various maps showing demands on the water supply and ground water there was a page on the ‘newspaper perception’ of the drought.

In his accompanying text Ken Gregory writes:

Extremes of weather conditions such as the 1975-1976 drought can be approached objectively employing established scientific methods, but the significance of the characteristics of a specific period of weather as perceived by the population as a whole depends upon the diffusion of information and upon the way in which it the physical events are portrayed by press, radio and television.

I think this is a fascinating insight given how firmly lodged ‘the heatwave of 1976’ is so firmly lodged in the public consciousness of the UK thanks to the media’s reminders of it.

Source: BBC News

So to see the level of media interest in the 1976 heatwave/drought Gregory set about measuring the column inches devoted to the issue and then calculating a point score to gauge the amount of coverage. A front page spread would be given a higher score than the same spread appearing on page 20, for example.

From this he was able to produce a map that showed media interest over time across 9 regions of England & Wales.

Source: Atlas of Drought in Britain 1975-1976

He found both national and regional patterns across ‘three phases of reaction’.

  1. Legacy of below average rainfall during the winter of 1975/76 leading to concern in South Wales about low reservoir levels.
  2. Late June & early July 1976 when the heatwave hit which was two weeks of shade temperatures exceeding 32 degrees C for two weeks.
  3. By August the extent of the drought was becoming clear, leading to a peak in interest.

There were interesting geographic differences in the length and timing of the reaction. Gregory noted that, for example, those regions benefitting from groundwater supplies, such as Southampton and Reading, moved on much more quickly from the issue during the autumn of 1976, whereas areas such as Derby were still suffering the effects of near empty reservoirs. The plot below gives an indication of how quickly interest grew and then slowed set against key events that year.

Source: Atlas of Drought in Britain 1975-1976

Of course the Internet and the decline in local media outlets means that such a map would not be possible to create today so we’d struggle to recreate Gregory’s analysis, but I would love to do a follow up to see how the media back then generated a collective memory that still impacts on perceptions of the record breaking summer of 2022.

More than arrows

UPDATE: If you would like a detailed reflection on this, I have co-authored an article with Alex Kent entitled Getting to the Point? Rethinking Arrows on Maps. You can read it here.

This week I took to Twitter to offer a critique on way we might map (at the time of writing) the nearly 1 million people fleeing Ukraine.

It’s time to innovate the ways we show people fleeing war. 8 arrows for 874,026 human beings is not good enough. It’s also the same visual language we use for the invadersIt’s clear but shows just 8 (shocking) numbers: Poland: 453,982 Hungary: 116,348 Republic of Moldova: 79,315 Other European countries: 69,600 Slovakia: 67,000 Romania: 44,540 Russian Federation: 42,900 Belarus: 341

It’s had a great response so I wanted to set out some of my thinking a bit more and feature some of the responses to my critique.

The first thing to say is that I am not singling out the BBC here for particular criticism – they do great work – theirs just happened to be the map that appeared first in my timeline. Second, I think we should acknowledge that the Ukrainian crisis is not the first – and sadly won’t be the last – that requires us to map the movements of millions of people.

When we create a map or chart we should ask ourselves three questions:

  1. Who is it for?
  2. What will the map be displayed as?
  3. Why is it being produced?

These questions are important because they will influence the information we include, its design and how we might share it. For example you cannot use video if you are creating a map to be printed on paper, and you wouldn’t use very technical language with lots of detail for a map that might be shown for a few seconds on TV to encourage an evacuation to safety. Click here for more examples.

So lets look again at the BBC map with the above questions in mind.

BBC map showing the numbers of people fleeing Ukraine
  1. Who: A global audience – probably one of the broadest and most global audiences there are. So the map needs to be easy to read, unambiguous and – crucially – factually correct.
  2. What: I think this is the biggest question that we overlook as consumers of these maps, but something that their designers have to grapple with. In this case the map needs to work as a thumbnail on social media, a slightly larger version on the BBC website and as an animation for the BBC News broadcasts. It needs to work the size of a postage stamp or a on an 86″ HD TV monitor. Nuance and detail are rarely options in this context.
  3. Why: To communicate the impacts of the invasion to as wide an audience as possible.

The map is effective based on these criteria – but I think it (and others like it) need to be looked at more critically to see how they might contribute to some of the more harmful narratives around migration.

Arrows

There’s an excellent piece by David Shariatmadari entitled ‘Swarms, floods and marauders: the toxic metaphors of the migration debate‘ that I thought of here – we often talk about a tide of migrants, which can be dehumanizing and a trope that the map – perhaps inadvertently – contributes to with the flow of blue cascading out of Ukraine*.

[*John Burn-Murdoch has questioned this association – for me I think its the combination of symbol + colour + language often used to describe such a map that gives this impression. On reflection the blue in and of itself is less of a concern (see The Economist’s map below, which I like. To follow discussion see here.]

It also gives the sense of invasion – not least because the same arrows are used in the BBC’s maps of the Russian advance.

I have nothing against arrows and connecting lines, they can be extremely effective, but in these maps they over-stretch the data.

We have eight numbers – nothing more – that are simply the counts of people who moved from Ukraine to neighboring countries. If we had city to city flows – or even detail of border crossings and routes taken then arrows can help here, but we don’t. With more flows you need some sense of direction so arrows are useful or as the New York Times has done here you can use tapered lines.

Source. NYT map of refugees leaving Syria.

The eight numbers (Poland: 453,982 , Hungary: 116,348, Republic of Moldova: 79,315, Other European countries: 69,600, Slovakia: 67,000, Romania: 44,540, Russian Federation: 42,900, Belarus: 341) are not so large they are hard to interpret, but large enough to be shocking and I think stand alone in their power. The BBC map groups them into 4 broad categories of unequal size.

The result is a loss of information combined with something that is a bit tricky to interpret – as you scrolled past on your phone, did you spot the second smallest category is 10 times larger than the smallest? This is immediately clear from the numbers.

With the lack of precise origin and destination information we also have to avoid the trap that arrows can give us a sense of the journey or flow. All we know from the data is that a border was crossed somewhere between two countries. Proportional circles overlain on a basemap, the approach taken by UNHCR, avoids this issue.

What can we do?

So how might we create more human, less stereotypical maps of people fleeing war, whilst still remembering the checklist of Who? What? Why?

Financial Times: Precision and Flow

This from The FT is a huge improvement – it keeps the dynamism and movement but it keeps the precision we have in the data.

FT version on Ukraine refugee movements.

They report the actual numbers – as well as the total over Ukraine – and sit the circles over the centre of each country to make it clear we have no more precise data on where people have moved to within countries. The choice of colour keeps us well away from the water imagery (tide, flood etc) we are so used to hearing and could do without.

Greater Humanity

An arrow or a line on a map can never capture the depth and diversity of experiences people have had following Russia’s invasion. The fear, the cold the uncertainty are best shared through words and pictures, but we can think about giving visual reminders that the arrows represent people and not something abstract or distant. In Atlas of the Invisible these are some of the issues we grappled with when trying to show cross border movements from Syria and opted for icons and smaller arrows. I reflect on the responsibilities of creating the map in this video.

So what are the other ideas people have had?

Ken Field responded with a map that breaks the arrows into dots to each represent 100 people.

Ken Field’s arrows from dots map.

It’s more abstract than using icons and serves to soften the arrows a little. With animation, perhaps to show the numbers increasing over time, it certainly underlines the numbers involved.

Daniel Huffman suggested the use of icons – in this case isotypes – to give a sense of the numbers.

Daniel Huffman’s isotype map.

The overall impact is less dramatic than sweeping arrows (I quite like that) but it slightly risks leaving people wanting more information – how many women vs men vs children have left Ukraine, for example? Can they be shown in the icons?

The final example from The Economist combines all of the ideas above.

Economist map of refugees leaving Ukraine.

Small icons give the immediate sense of people on the move but are abstract enough for people not to hanker for more detailed demographics, they are moving to the centre of countries shown as proportional symbols with the exact figures and there is no sense of using arrows etc for dramatic effect – things are dramatic enough already!

Joshua Stevens has posted a great response to these points – see here.

A Couple of Final Examples

It is impossible to create maps that can truly share the full complexity – and horrors – of war and there is a place for more abstracted representations of it, especially in breaking news situations. After all the maps often supplement text, video and images that are able to offer the important personal experiences much more effectively.

That said, here are a couple of inspiring examples of maps that do add the extra layers or detail or capture the human element lost to arrows.

One of my favourite is Levi Westerveld’s Those Who Did Not Cross that attempts to visualise the extent of the deaths in the Mediterranean as people attempt to cross to Europe. He has made some compromises around the precise locations of shipwrecks and so on, but that doesn’t matter. What we see here is the scale of the toll.

Source. Levi Westerveld.

This ESRI Story Map The Uprooted is a nice example of combining a range of media – with the maps front and centre – to help communicate the breadth and depth of the journeys taken to Europe around 2016.

Both maps however take much more time to make than the BBC one and only work in specific formats so they won’t be reproduceable in breaking news stories, but there are elements we might take forward and develop when we think more carefully about how to show human flows.

For more on Ukraine maps…

This is an interesting article from Mateusz Fafinski worth checking out.

PhD Opportunity: An Atlas of Health and Social Inequalities

Excited to announce that we have funding for a +3 studentship in the UCL Department of Geography for the project “An Atlas of Health and Social Inequalities”. The research will be carried out in association with the Health Foundation and will comprise the creation of a range of innovative datasets presented through a series of ground-breaking maps and graphics. The project will centre on the Health Foundation’s Social and Economic Value of Health: Place programme, which is designed to generate new knowledge about the ways in which the physical and mental health of a population shapes their social and economic outcomes. The Health Foundation have funded a number of research projects already that focus on understanding the relationship between a given population’s health and the health of individuals within that population.

The PhD will benefit from insights from these projects and focus on the creation of a nationwide atlas to demonstrate the social and economic value of health. It will produce a series of research-led maps created from innovative and granular datasets to demonstrate the new ways that health data can be visualised. These will convey a range of variables including health metrics such as mortality, self-reported health, prevalence of specific health conditions, and social and economic outcomes including employment, pay, structural changes to industrial sector composition and social fragmentation.

The work will be supervised by myself (james.cheshire@ucl.ac.uk) and Dr Anwar Musah (a.musah@ucl.ac.uk), to whom enquiries may be directed. The successful applicant will hold a First or Upper Second Class honours degree in a quantitative social science or computer science discipline and/or similar Masters qualification.

For further details on eligibility etc please see here.

CLICK HERE TO APPLY (Deadline 4th April)

Being creative is reason enough to try different data visualization

A simple line chart might be all you need to communicate the patterns in a dataset, but it might not be given a second glance. Getting the viewer to work a little harder to interpret and think about a graphic can be a very effective way of generating engagement. This is where the art meets the science of data visualisation.

There are many ways charts can misfire, but that doesn’t mean we shouldn’t try something new and it certainly doesn’t mean we should heed calls to do things the ‘right’ way if we miss a chance to change how people look at a dataset.

In the case of this ‘tapeworm of doom’ plot by NYT, it has certainly worked!

I actually rather like it and think it does it’s job well….so in it’s honor and in honor of any viral plots in the future, here’s my favorite examples of maps/ charts that you can say present data a particular way for ‘literally no reason’. Or you can say by doing something a bit differently they create much more engaging graphics – I’ll leave it to you to decide!

Du Bois’ Spiral

A hero of mine and pioneer of innovative visual forms, Du Bois chose a spiral over a bar chart for his ‘City and Rural Population’ graphic, and what a difference that makes. You can read more here and here, buy the book if you can.

Emma Willard

Emma Willard pioneered many maps/ graphics but the example I want to flag here is her ‘Temple of Time’. A normal timeline would have sufficed, but we wouldn’t be talking about it now.

Messing with Maps

Maps are full of distortions, but we are used to seeing them with north at the top. The sea is generally blue, the land green and all to often Europe is at the centre. You might ask why we should mess with these established norms if people are used to them – I would argue that if you can effectively disorientate the reader then you can get them to think much more deeply about the map. I’m not suggesting all maps should do this because done badly it’ll cause more harm than good, but here some examples that I think work well.

Sabine Réthoré‘s rotated Mediterranean completely threw me when I first saw it, and got me to really re-appraise my impressions of the region.

The ‘Spilhaus Projection‘ is one I really love and that we used in Atlas of the Invisible to show ‘One Stormy Sea‘. By pushing the land to the edges you get a single connected ocean view that would be hard to appreciate with a more traditional approach.

Inspired by Nature

Pedro CruzJohn WihbeyAvni Ghael, and Felipe Shibuya drew inspiration from tree rings to show the history of migration into the US. A stacked bar chart would have done this too, but would not have been as widely shared as this approach. You can see an animation here.

Power in Imagery

Valentina D’Efilippo’s Poppy Field chart is a multi-dimensional plot that charts the deaths during the Great War. Much of the data could be portrayed as a scatter chart with proportional symbols, but choosing the imagery of a poppy adds a powerful angle that leaves the reader in no doubt about the horrors of war.

Joy of Circles

This SCMP chart of the world’s languages carves out proportions of a circle – a square treemap might have done it just as well, but visually would have lacked the appeal of this perhaps less precise approach.

Peaks and Troughs

Finally, I created this map of world population nearly a decade ago to show it’s peaks and troughs. You can’t accurately establish the population of specific regions, perhaps as you might a choropleth, but that isn’t the point.