Skip to content
James Cheshire
About
Blog
Teaching
Papers
Tag:
ggplot2
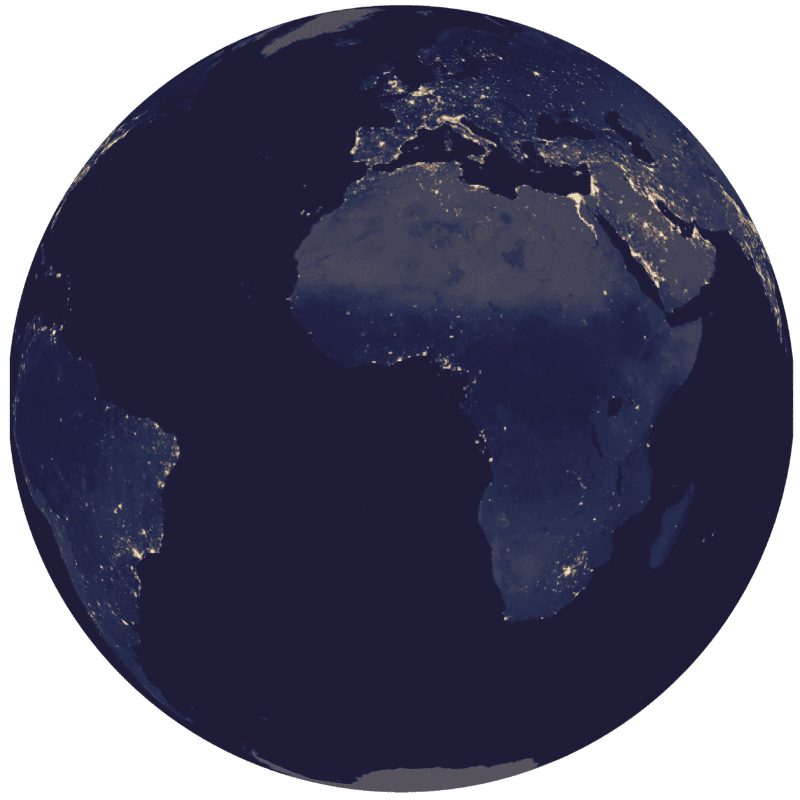
Spinning Globes With R
May 16, 2017
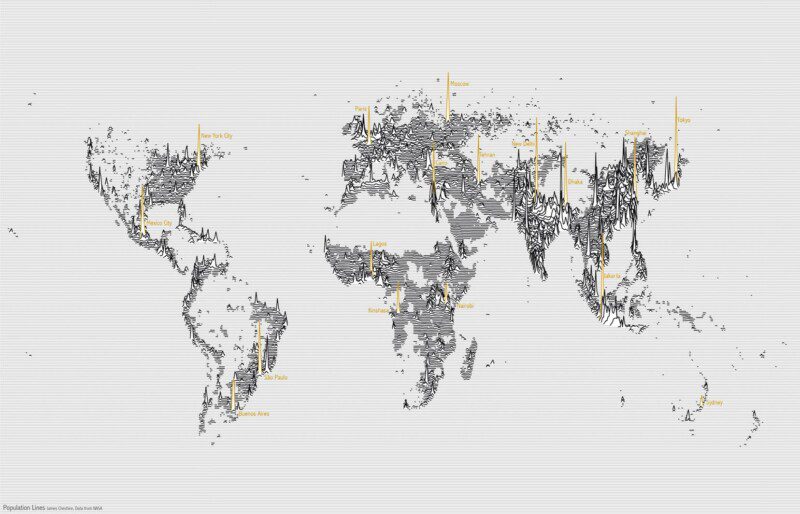
Population Lines: How and Why I Created It
Apr 27, 2017
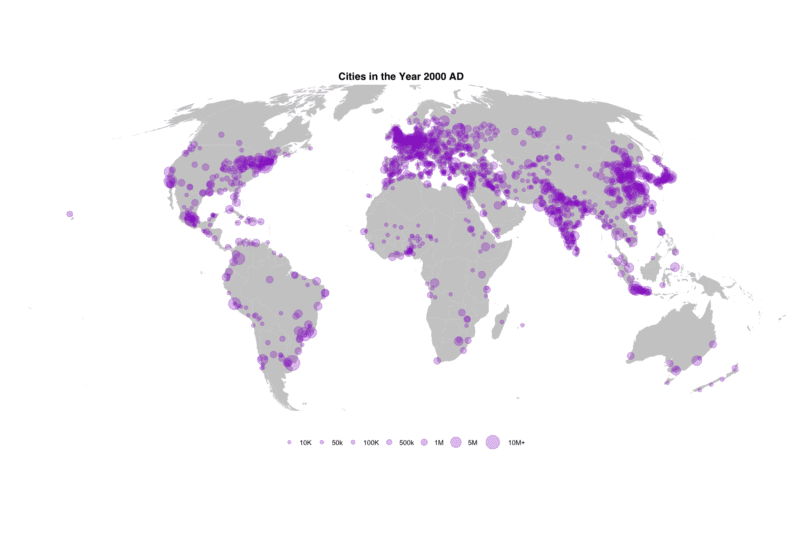
Mapping 5,000 Years of City Growth
Mar 6, 2017
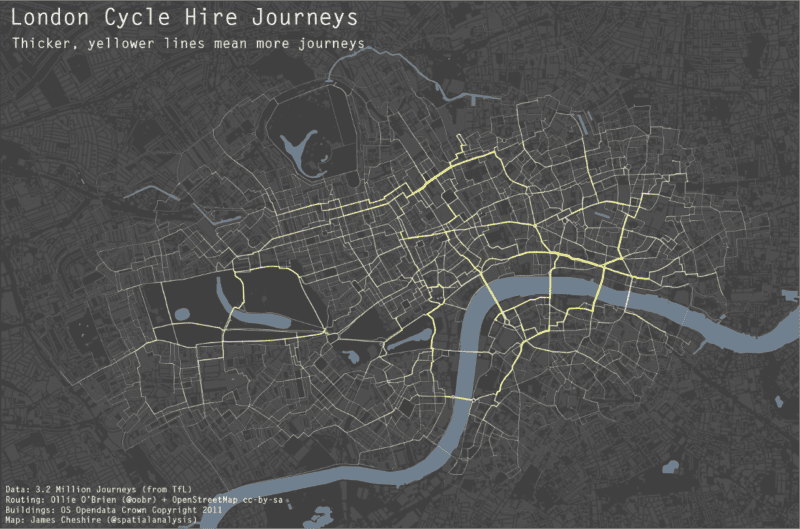
Mapping Flows in R
Mar 30, 2015
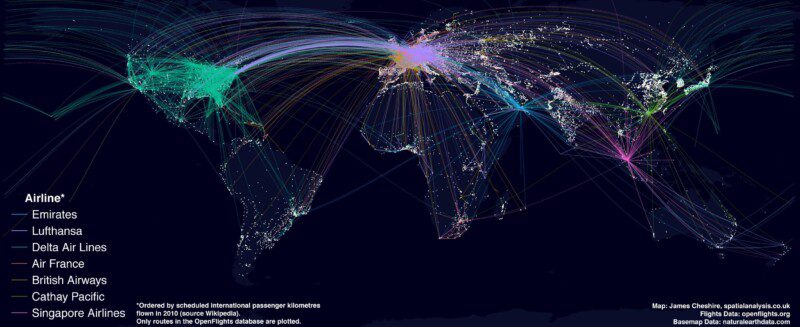
Mapping the World's Biggest Airlines
Jun 7, 2012
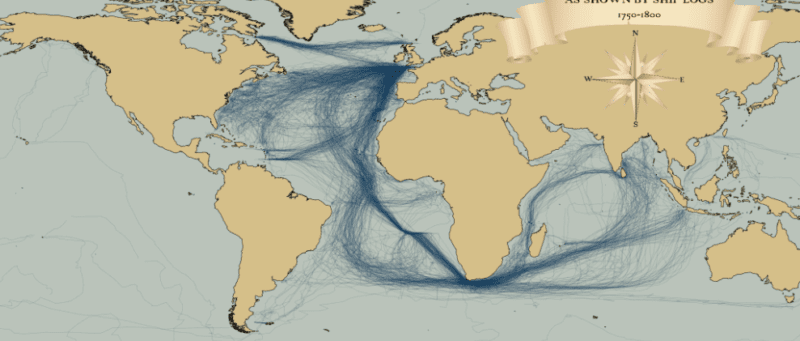
Mapped: British, Spanish and Dutch Shipping 1750-1800
Mar 30, 2012
Great Maps with ggplot2
Feb 2, 2012
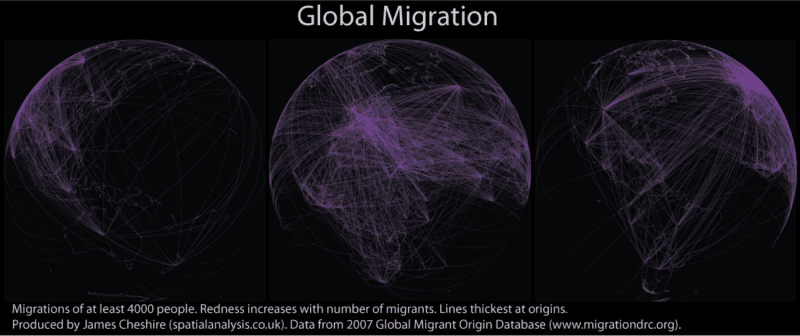
Global Migration Maps
Mar 17, 2011