Skip to content
James Cheshire
About
Blog
Teaching
Papers
Tag:
rmaps
How England’s complicated political geography is confusing coronavirus rules
Aug 12, 2021
Spinning Globes With R
May 16, 2017
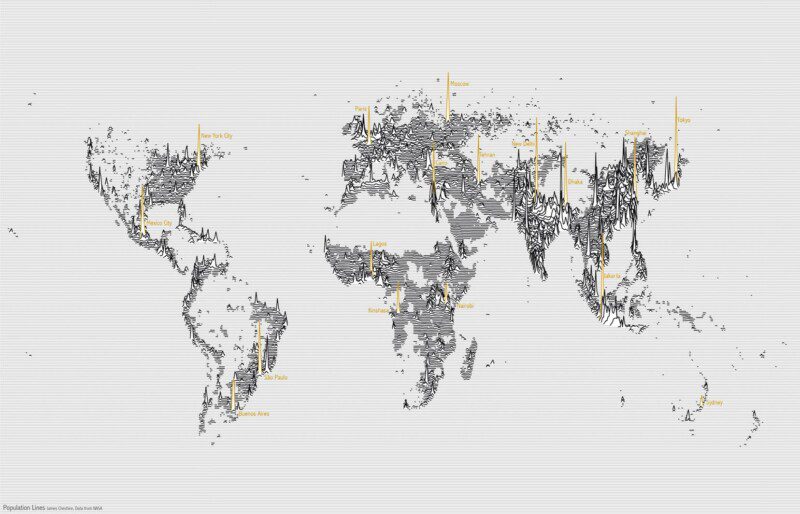
Population Lines: How and Why I Created It
Apr 27, 2017
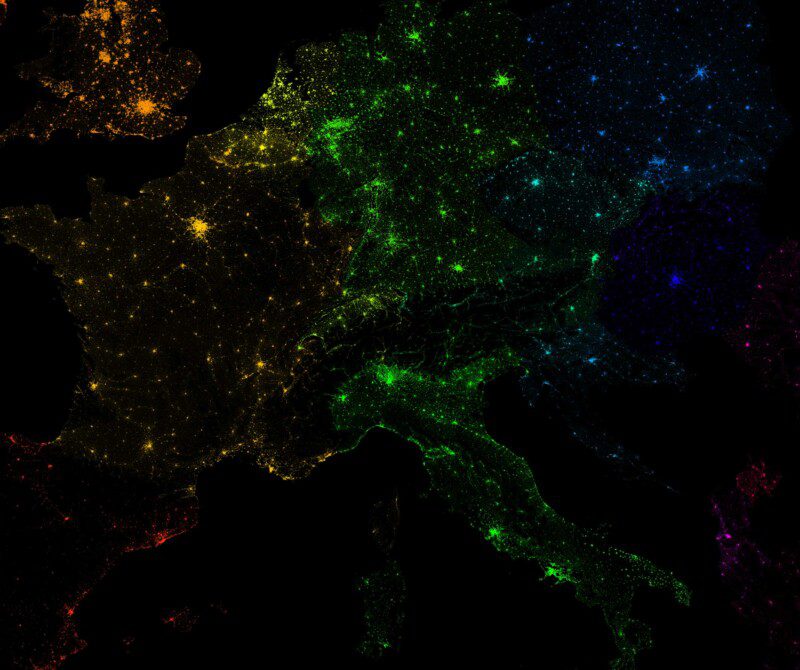
10 Million Dots: Mapping European Population
Mar 23, 2017
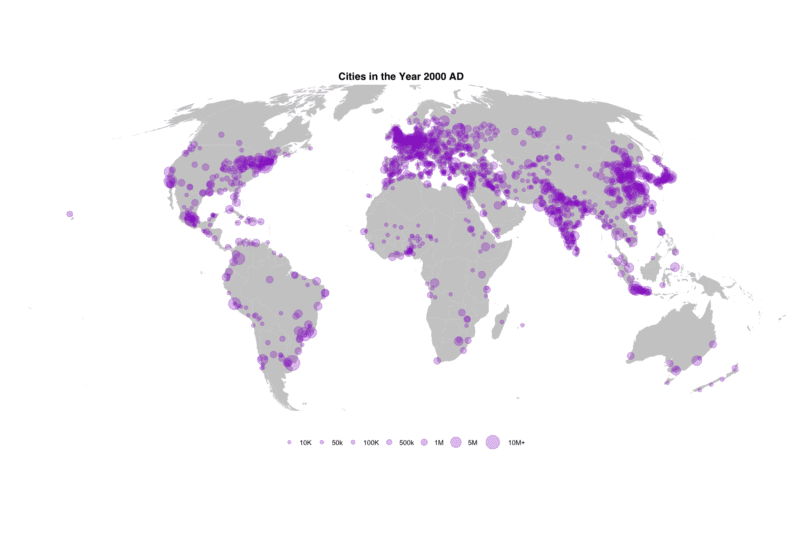
Mapping 5,000 Years of City Growth
Mar 6, 2017
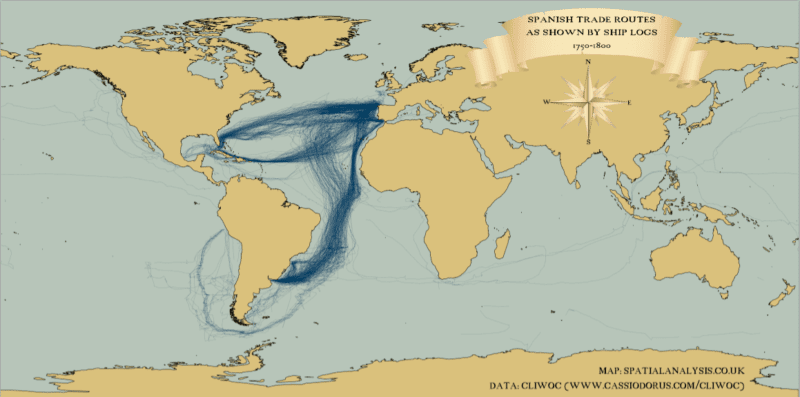
Mapping (historic) tracks in ggplot2
Oct 10, 2016
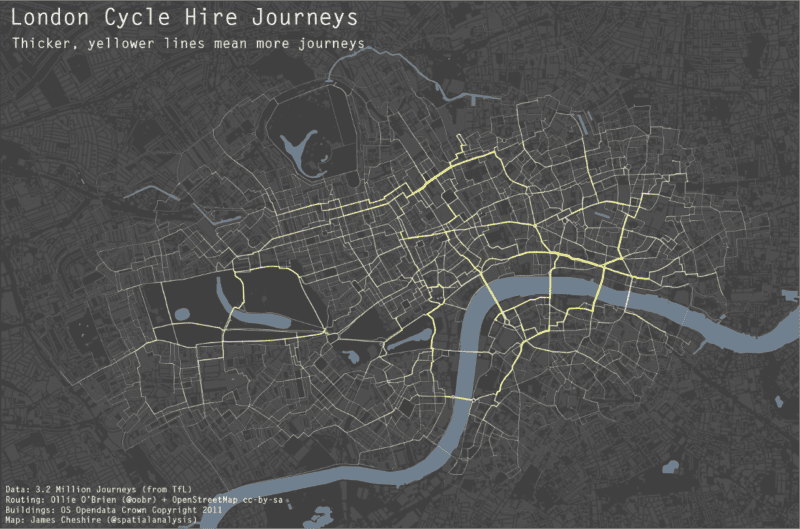
Mapping Flows in R
Mar 30, 2015
Great Maps with ggplot2
Feb 2, 2012
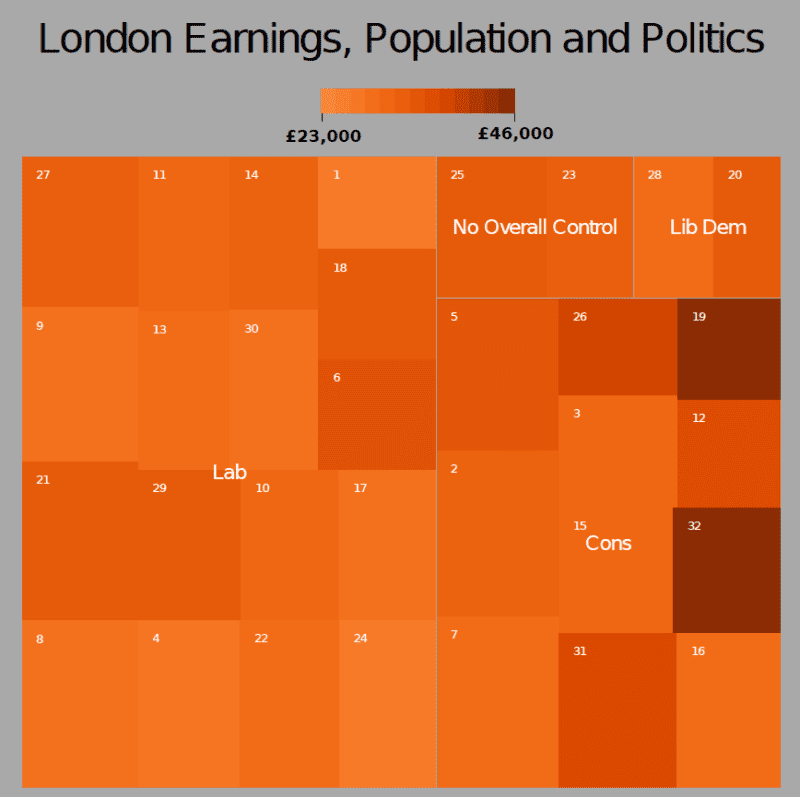
Improved Tree Maps with R
Aug 17, 2011
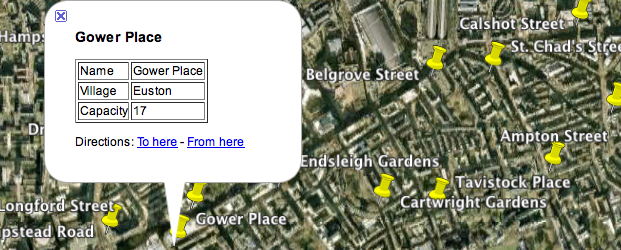
Exporting KML from R
Jan 3, 2011