Skip to content
James Cheshire
About
Blog
Teaching
Papers
Tag:
London
The long history of using maps to hold water companies to account
Oct 8, 2022
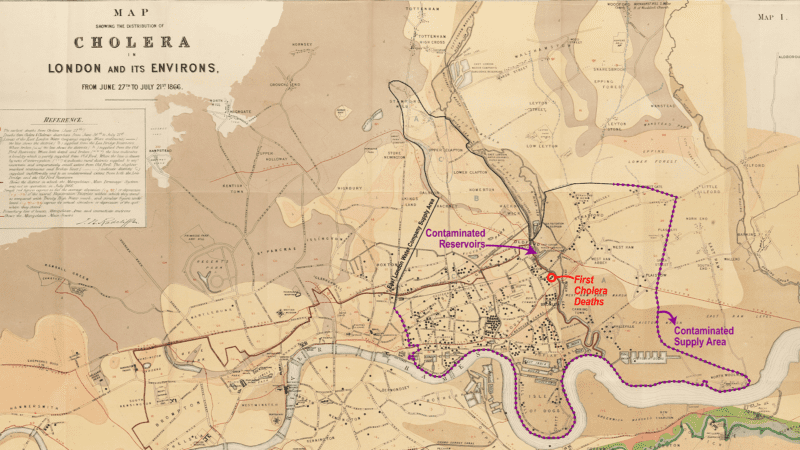
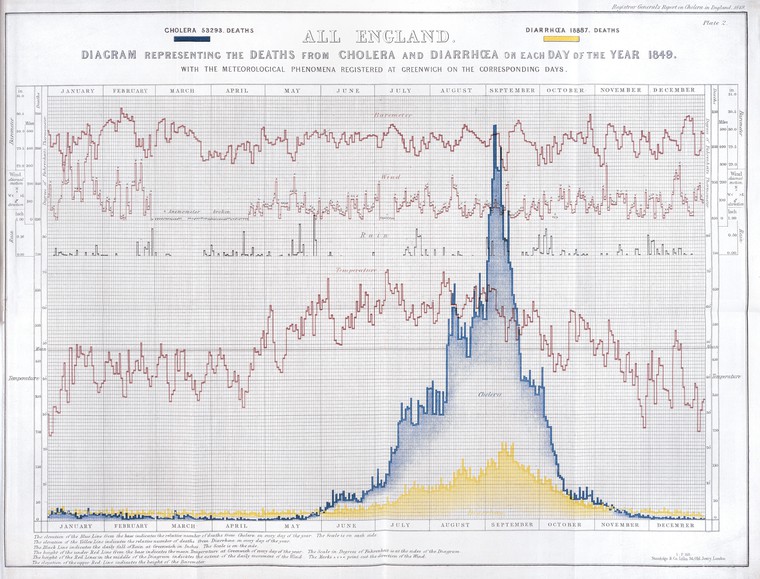
How the Victorians Mapped London’s Cholera
Mar 2, 2019
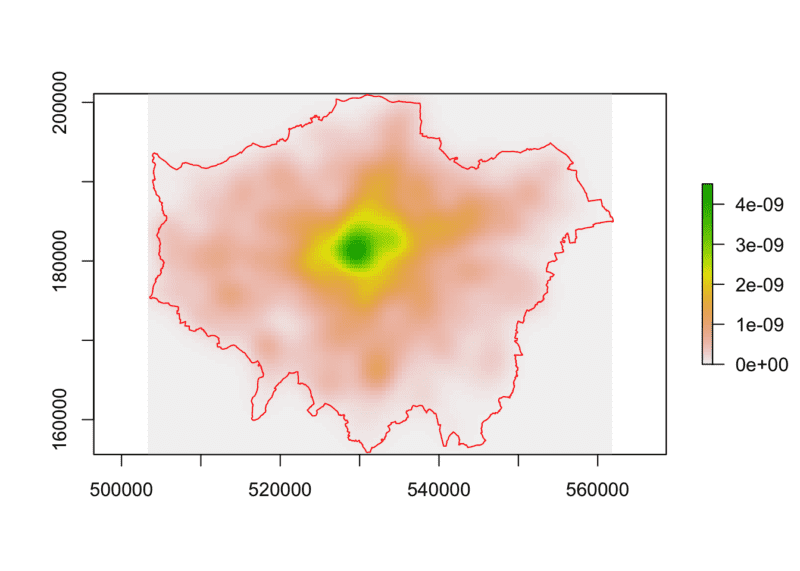
Point Pattern Analysis using Ecological Methods in R
Dec 12, 2017
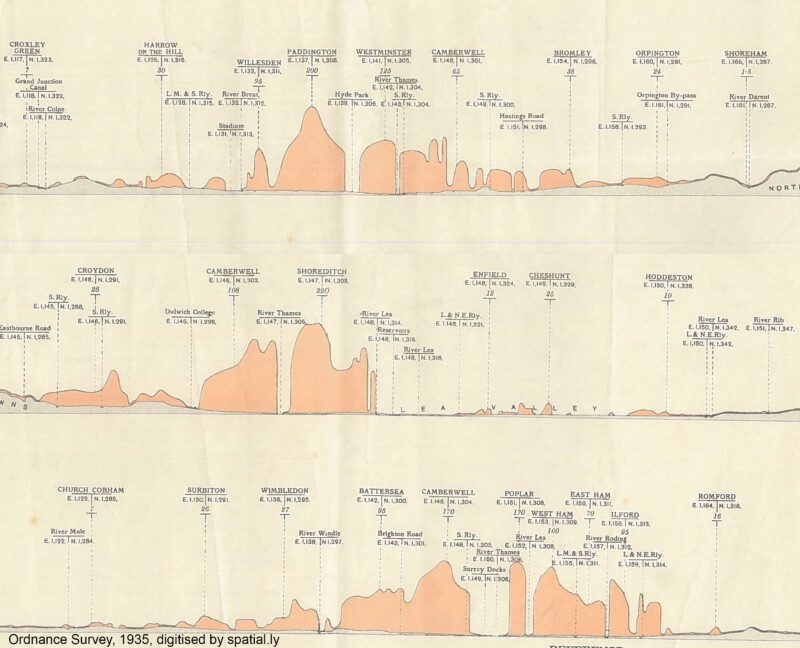
London's Population Profile in 1935
Nov 10, 2017
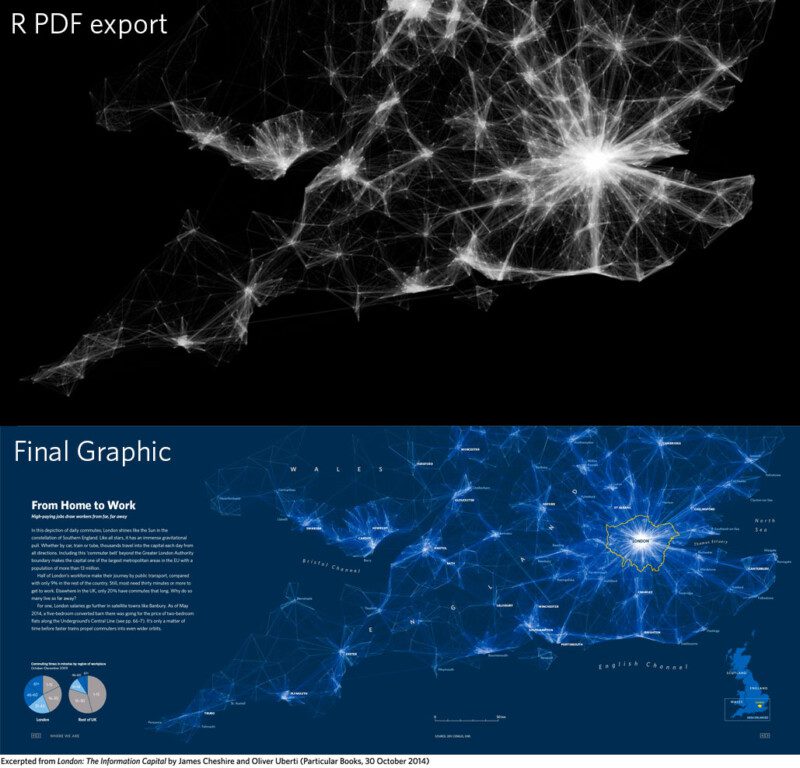
Improving R Data Visualisations Through Design
Nov 6, 2014
London: The Information Capital
Sep 30, 2014
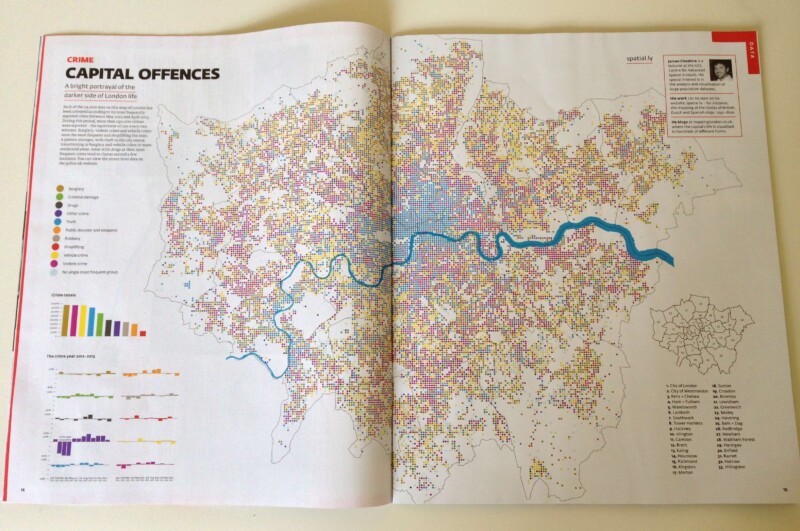
Crime Map of London
Jul 27, 2013
Mapped: London's Fire Engine Callouts
Jun 3, 2013
Mapped: Twitter Languages in London
Oct 22, 2012
Sensing the City: Mapping London's Population Flows
Apr 26, 2012
1
2
Next Page