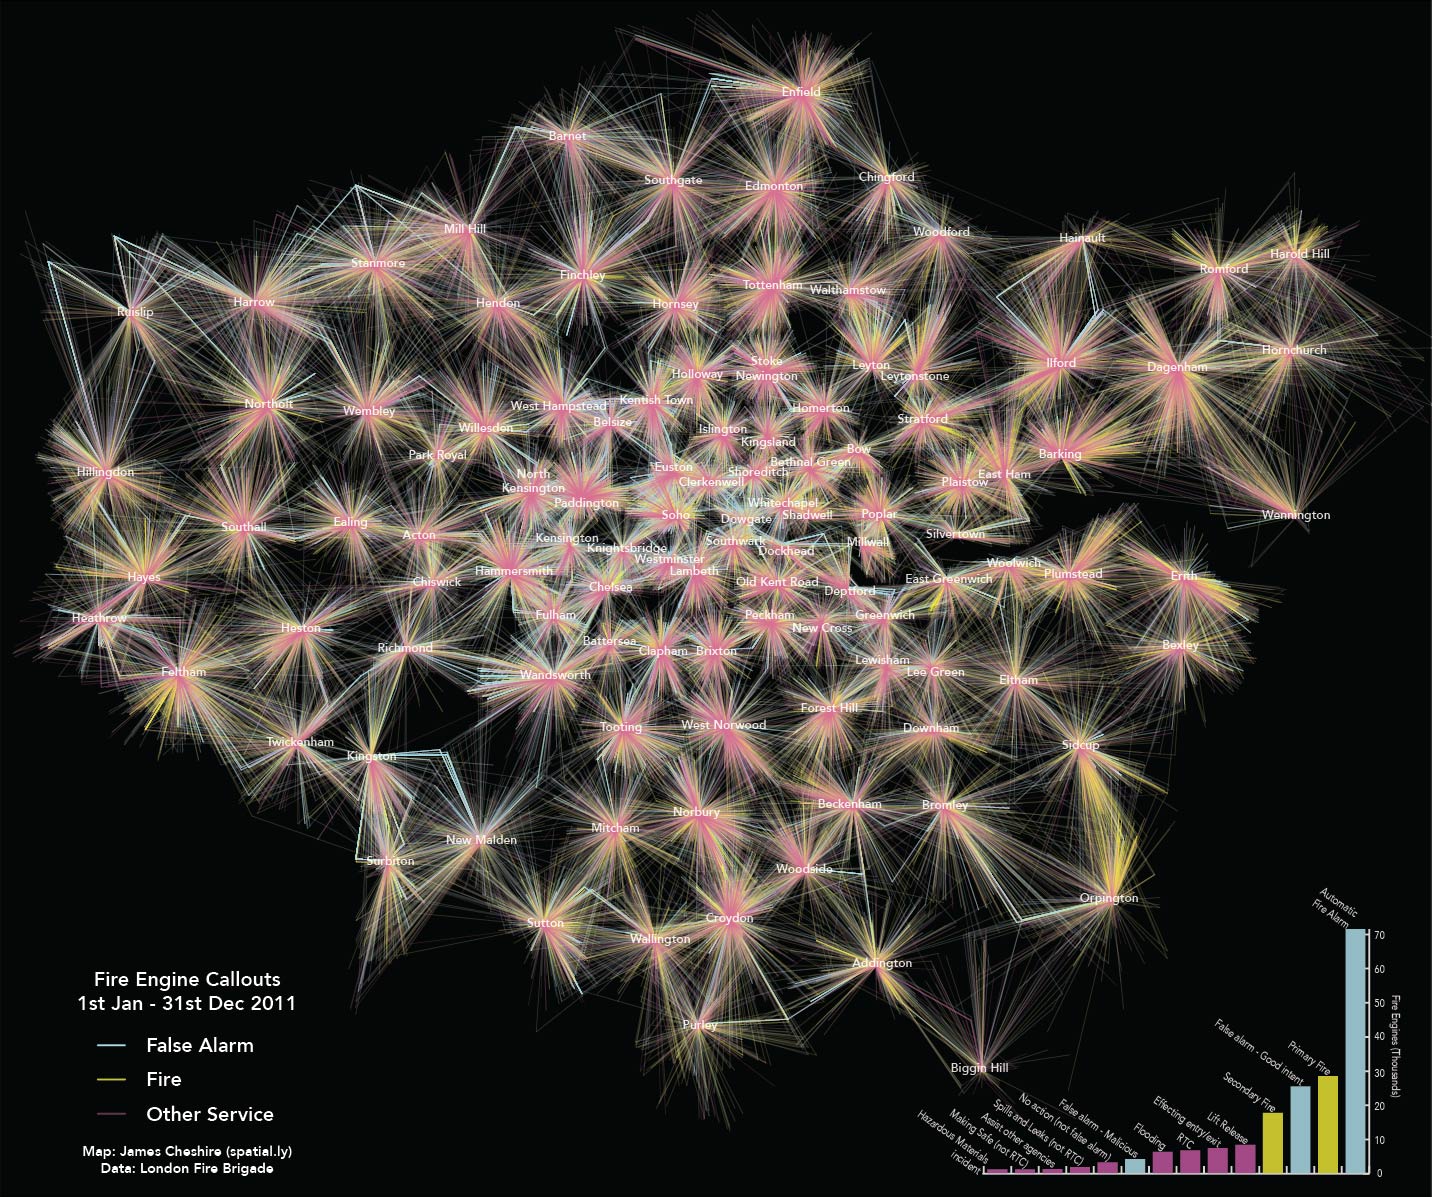
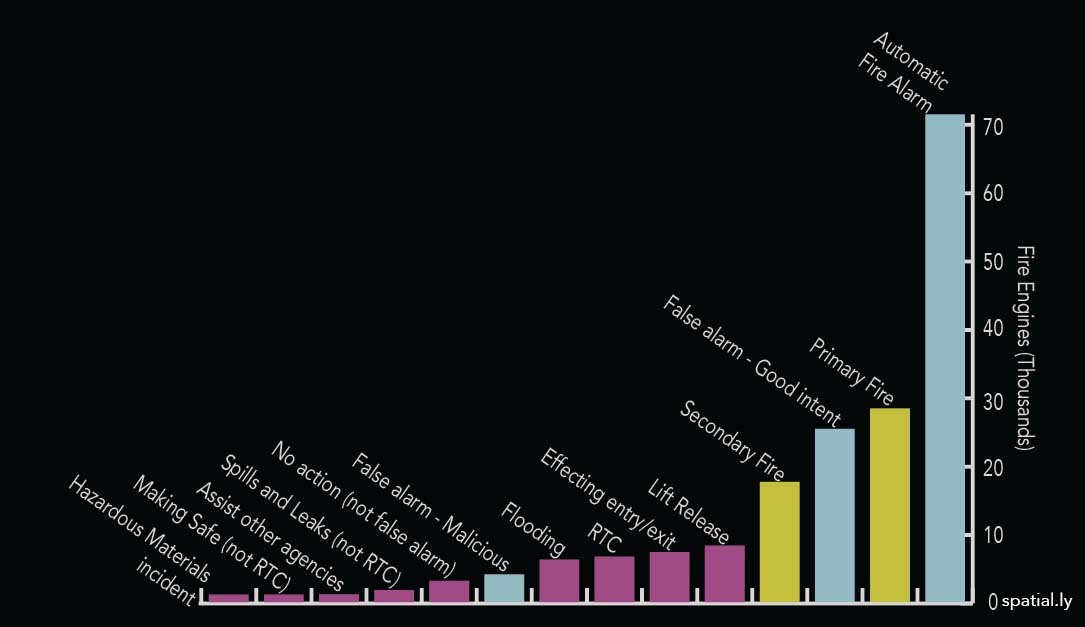
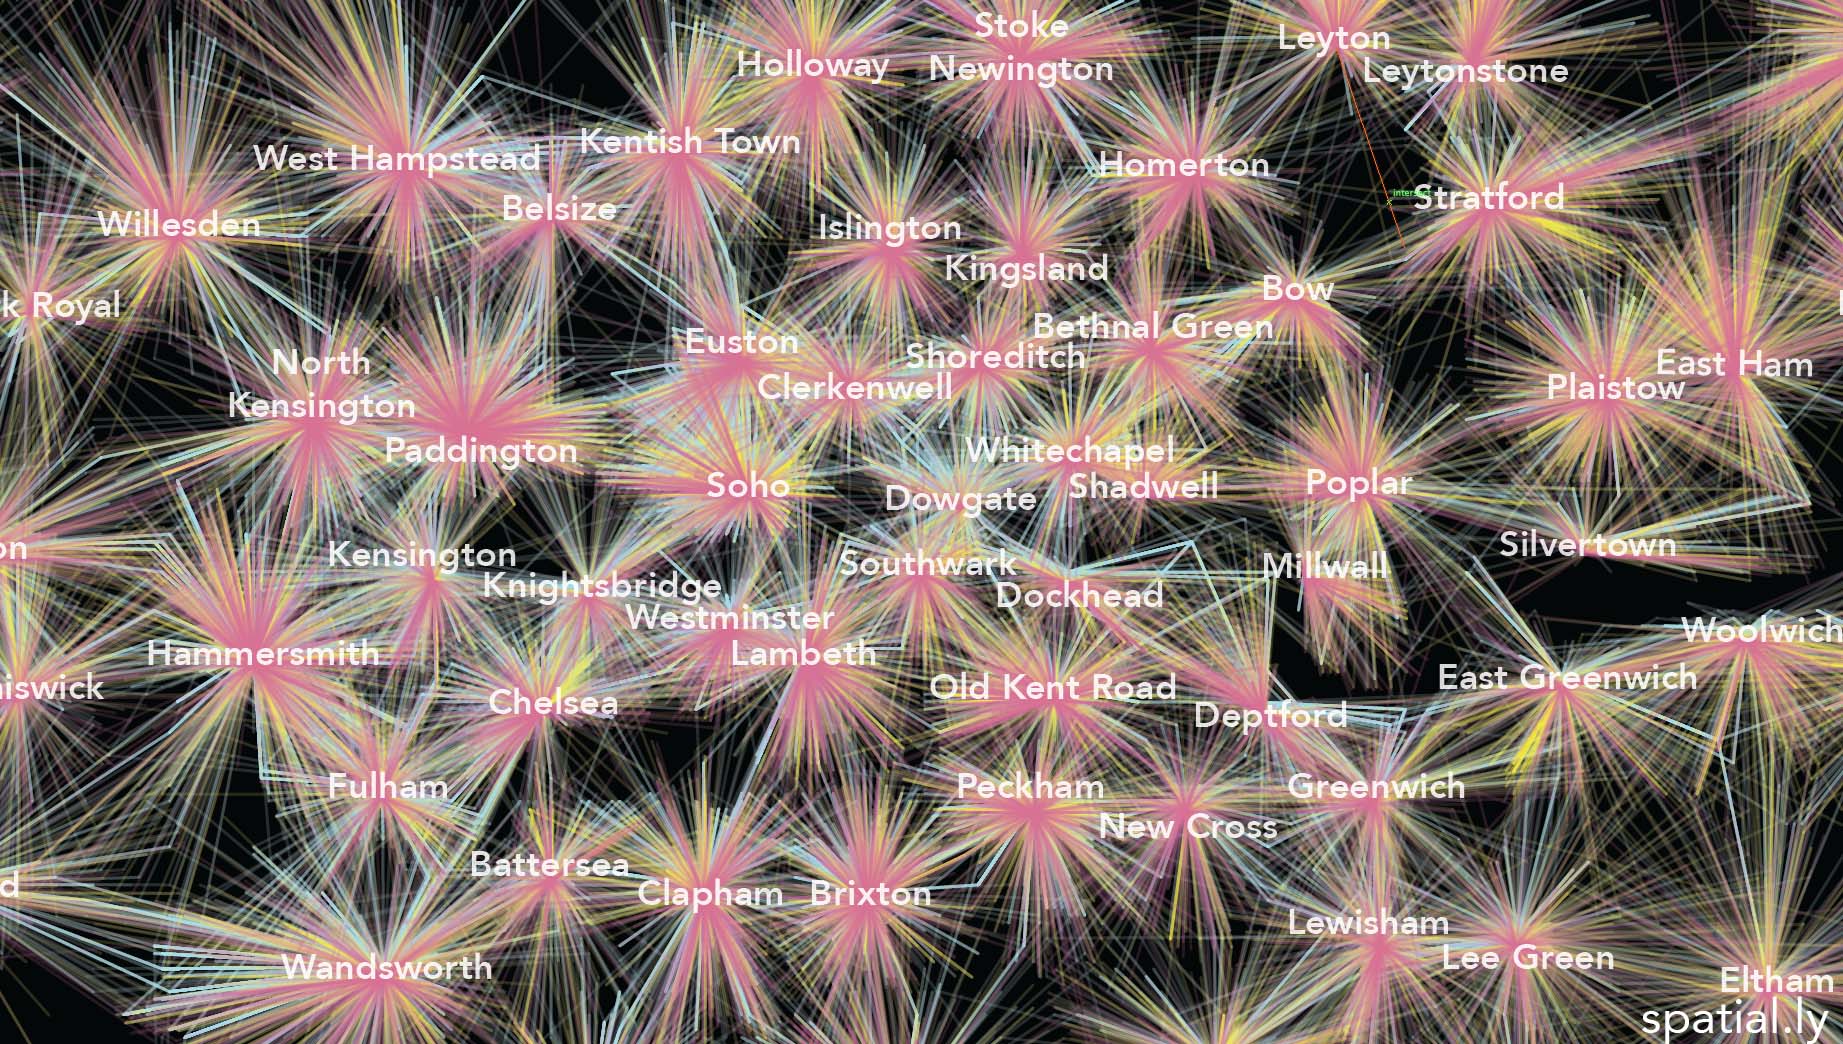
This map shows the geography of fire engine callouts across London between January and September 2011. Each of the 144,000 or so lines represents a fire engine (pump) attending an incident (rounded to the nearest 100m) and they have been coloured according to the broad type of incident attended. These incident types have been further broken down in the bar chart on the bottom right. False alarms (in blue), for example, can be malicious (fortunately these are fairly rare), genuine or triggered by an automatic fire alarm (AFA). As the map shows, false alarms – thanks I guess to AFAs in office buildings – seem most common in central London.
Actual fires occupy fewer fire engines than false alarms and other services (such as road traffic collisions (RTCs) and flooding), but as one might expect they appear to be a greater part of the incidents attended in more residential areas. As this map demonstrates, the London Fire Brigade deals with a huge number of incidents, and it is great that they have shared the data to help us study them.
Details
The data used for my map were requested back in February by the Financial Times who wanted to map London Fire Brigade’s response times to illustrate the possible impact of proposed fire station closures. The full dataset covers 5 years and is available on the London Datastore (data link here). The data are provided as a .csv file that can be easily uploaded into a database for analysis and visualisation. There is even a comprehensive metadata table to explain what is going on and an email address of a person to contact.
Within the dataset, the primary and secondary fire stations that send fire engines are listed and it is these that generate a line on the map above. For many incidents it is hard to tell how many fire engines went from each station (only the total is provided) so I have left this information off the map, simply showing the link between the station(s) and incident as a single line. That said I have used fire engine callouts in the map and bar chart, not simply number of incidents as I wanted to give an impression of the resources deployed in each case.
