Skip to content
James Cheshire
About
Blog
Teaching
Papers
Tag:
opendata
Mapped: London's Fire Engine Callouts
Jun 3, 2013
In Maps We Trust
Aug 17, 2012
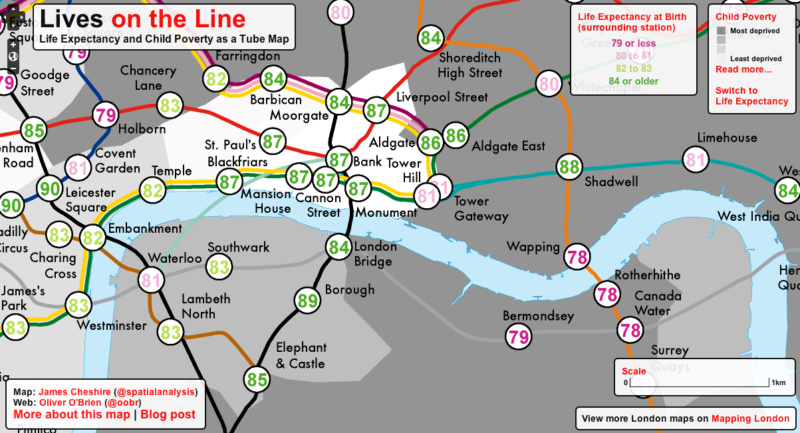
Lives on the Line: Life Expectancy and Child Poverty as a Tube Map
Jul 19, 2012
Mapping London's Population Change 1801-2030
Feb 16, 2011
2010 Muslim Populations By Country
Jan 28, 2011