Skip to content
James Cheshire
About
Blog
Teaching
Papers
Category:
Atlas of the Invisible Education
Atlas of the Invisible: Behind the Maps
Jan 18, 2022
Do Maps Lie?
Jan 18, 2022
Anxiety and Mapping the Climate Crisis
Jan 18, 2022
How clean is the air we breathe?
Nov 2, 2021
Do you suffer from flygskam [flight shame]?
Sep 29, 2021
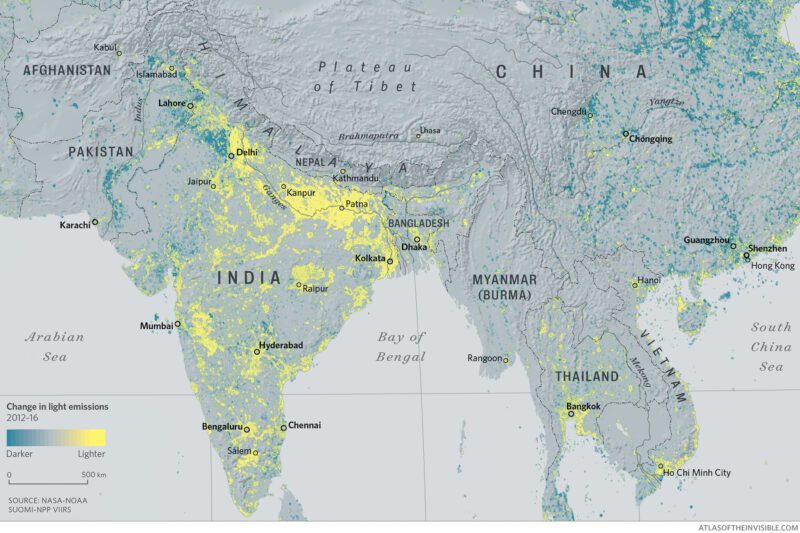
Changing light levels
Aug 25, 2021
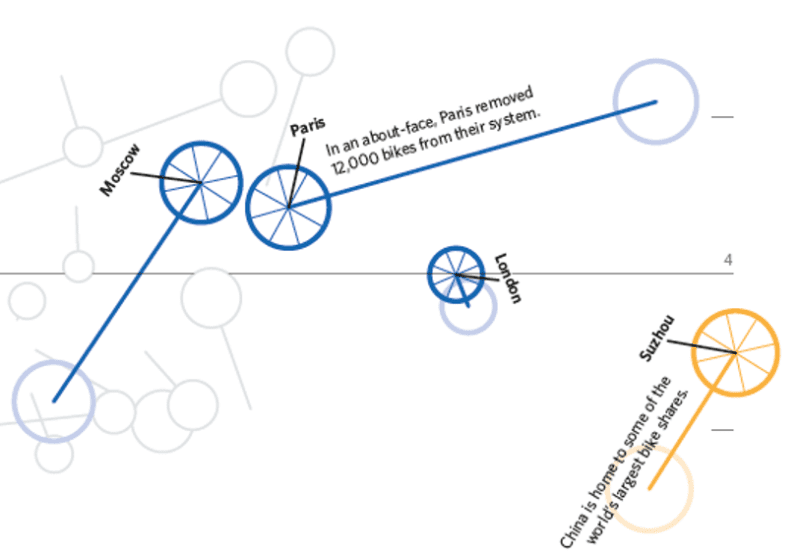
The rise of bicycle sharing schemes
Aug 25, 2021

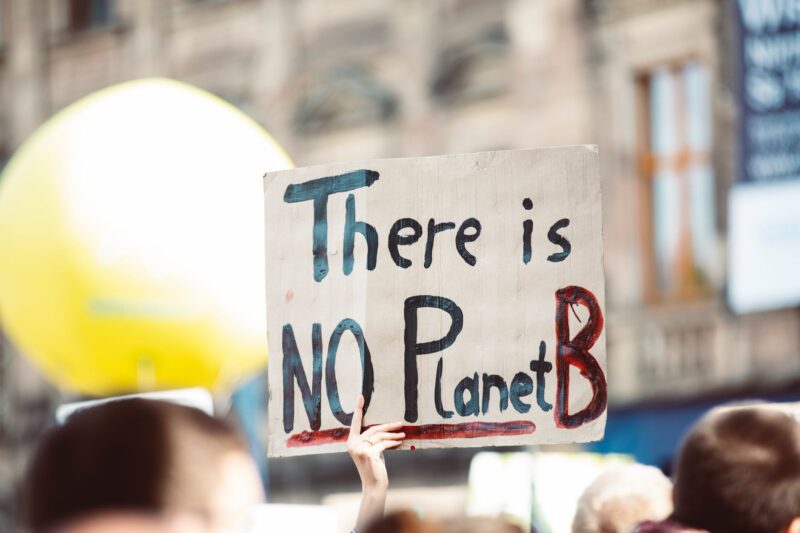

![Do you suffer from flygskam [flight shame]?](https://jcheshire.com/wp-content/uploads/2021/08/Guardian_01_Carbon-Overhead-800x533.jpg)