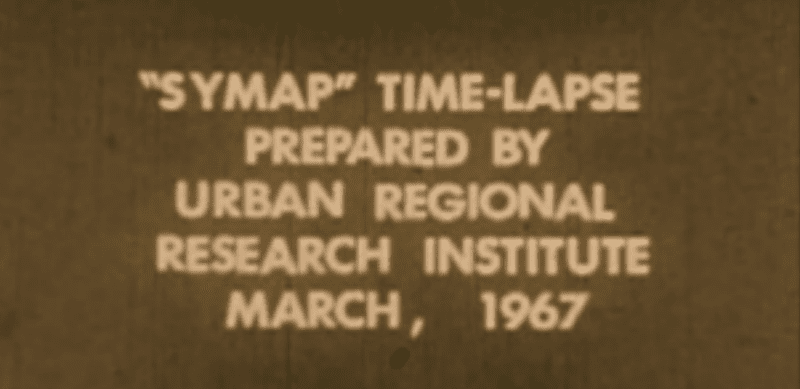
I hadn’t seen this video before. It demonstrates one of the earliest attempts at automated cartography for the display of time with spatial data. Truly ground breaking, the video shows the urban growth of Lansing at 5 yearly intervals from between 1850 and 1965 and was produced by Allan Schmidt at the Michigan State University Urban Regional Research Institute. The visualisation was produced with the synergraphic mapping system (SYMAP) developed by Howard Fisher in the mid 1960s. More details and a fully downloadable version can be found here. A presentation on SYMAP is available here. The sequence starts with a slow version of two minutes forty-five seconds before repeating the sequence more rapidly in forty-five seconds, and finally in five seconds.
http://video.google.com/videoplay?docid=2350215725557772618#
Automated Cartography: The urban expansion of Lansing
