Click here to access the Google Doc of these resources.
In the introduction to ‘Atlas of the Invisible‘ the authors explain how information from different sources, places and time scales can be brought together through maps and graphics to enable us to make sense of the world, exploring patterns and concepts and their related opportunities and threats.
In the nineteenth century people tended to specialize in specific areas, researching them in depth. Humboldt (1767-1835) ‘included art, history, poetry and politics alongside hard data’.
What are the advantages and disadvantages of these two approaches to exploring the world around us?
| Advantages | Disadvantages | |
|---|---|---|
| Specific | ||
| General |
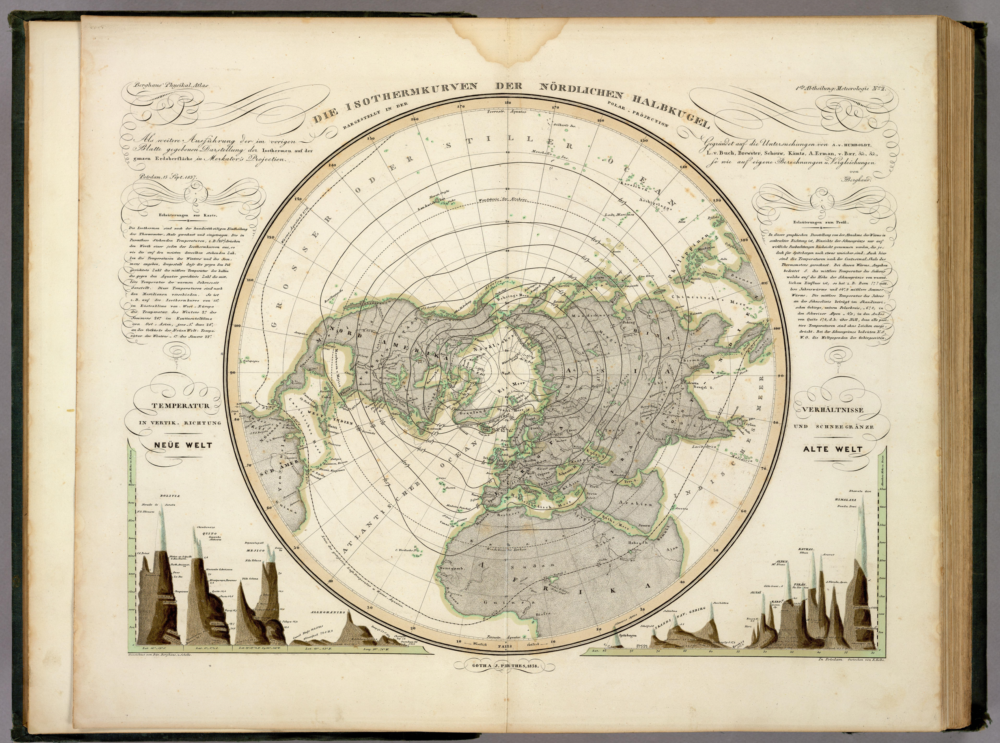
Humboldt asked his friend Berghaus to create an atlas to help him share his ideas about nature and its interconnectedness. His Physikalischer Atlas (1838) eventually included 75 maps full of rich data and was the first atlas to go beyond just showing where places were and who owned them.
Take a look at an atlas, preferably as hard copy book rather than online. How is data presented in this book of maps and charts?
Data visualization developed rapidly in the nineteenth century, then in the twentieth century digital systems enabled ‘mathematical functions [to] generate maps with the press of a button’. This developed into Geographical Information Systems (GIS), allowing cartographers to store data by theme as a series of layers to be combined on a map.
How have you used GIS in your geography lessons?
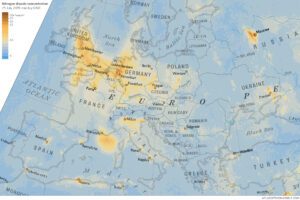
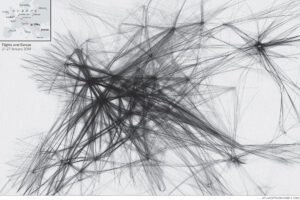
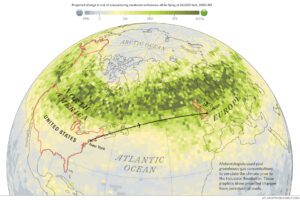
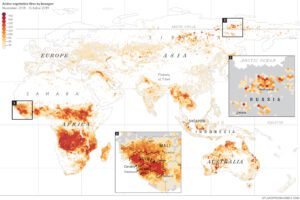
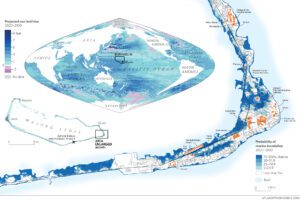
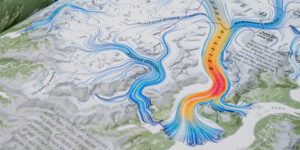
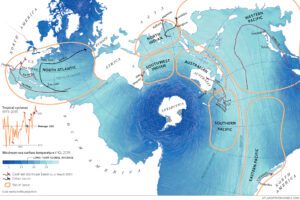
The aim of Atlas of the Invisible is slightly different – it is to show patterns, not places. The maps and graphics use data ranging from happiness levels to sea level temperatures and display it at a variety of scales, using different graphical styles and map projections.
The text provides ideas to support your thinking, but then it is over to you. What can you see? What can you learn? What will you do with this information?
Guided reading
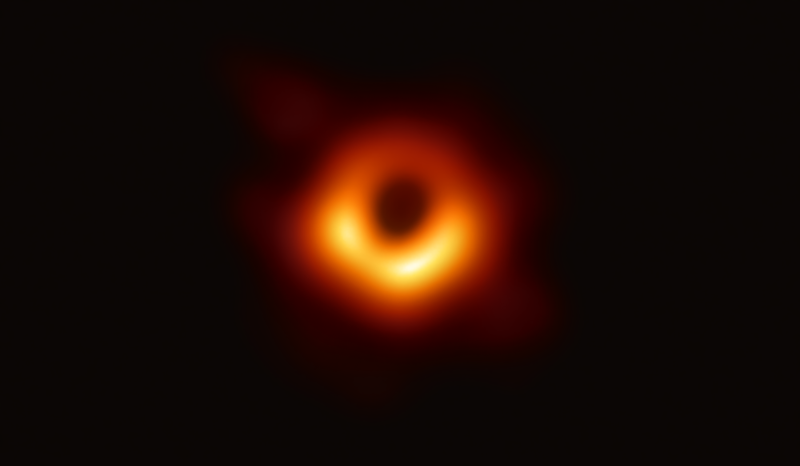
Quote 1: ‘To the untrained eye, both images are as undecipherable as glyphs from an alien language.’
What is meant by a ‘glyph from an alien language’?
How are Franklin and Bouman able to make sense of what they see?
Quote 2: ‘see the infinitesimally small and the incomprehensibly large’
What is being referred to here?
Why were these ‘invisible’ before?
Quote 3: ‘It’s not just size that renders something invisible’
Give two more examples of how something around us can be invisible.
Quote 4: ‘The patterns hidden in a dataset only truly emerge through maps and graphics. These visualizations give us the power to zoom out, to compare, to remember.’
How can maps and graphics enable us to ‘behold the invisible’?


