Click here to access the Google Doc of this resource.
A glacier is a river of ice dependent on enough snow falling at the top to provide the ice that then moves downhill, and begins to melt.

Snow and ice accumulate (build up) at the start of the glacier and, if the weight is great enough, become compacted, forming glacial ice. This ice moves downhill due to the force of gravity.
Glaciers move in two ways:
- Internal deformation – when the ice itself flows
- Basal slip – when the ice slides over the ground
As glaciers move downhill the amount of ablation (ice loss) will eventually become greater than the amount being accumulated. The line between the zone of accumulation and the zone of ablation is called the equilibrium line.
This line moves if the mass balance (difference between the amount of material accumulated by a glacier and the amount lost due to ablation) changes. It goes uphill to higher elevations if there is less snow and more melting, and downhill to lower elevations if there is more snow and less melting.
Glaciers advance and retreat according to seasonal changes and also to longer term changes in climate. These changes also affect the velocity of glacial ice as warmer temperatures lead to more melt water, which acts as a lubricant that makes it easier for the glacial ice to move.
Melting glaciers lead to a positive feedback loop as the cleaner and more reflective snow and ice is lost to reveal layers that are darker (as they have more rocks mixed with them) and also the mountainsides either side of the glacier become more exposed and begin to absorb heat. This means that more radiation is absorbed, further increasing warming in the area, which in turn leads to more ice melt.
What difference will global warming make to a glacier’s
- Equilibrium line?
- Mass balance?
- Velocity?
To what extent do you think it is necessary to understand glaciers as a system to appreciate the impact of climate change on glaciers?
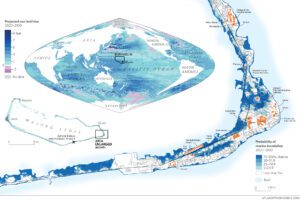
Look at the Ice Flows maps to see the surface velocity of glaciers on the Juneau Icefield and the Greenland ice sheet. The Taku glacier in the Juneau Icefield has a negative mass balance and may be gone in 200 years, whilst the Greenland ice sheet lost 600 gigatons of ice in 2019.
Guided reading
‘From the centre of it all flows the mighty Taku Glacier, which, despite global heating, was still advancing until 2018. Then the retreat began.’
What is a glacier?
What is meant when a glacier is advancing?
What does ‘Then the retreat began’ mean?
‘Scientists…use a simple formula called ‘mass balance’ to gauge the health of this system.’
What is the mass balance of a glacier?
Why has this inverted in the case of the Taku glacier?
‘With less snow and ice to reflect the sun’s rays and more exposed rock to absorb them, temperatures in the region will increase and hasten the retreat.’
How does this statement link to the idea of a positive feedback loop in the glacial system?
Why could this mean the Icefield could be gone in just 200 years?
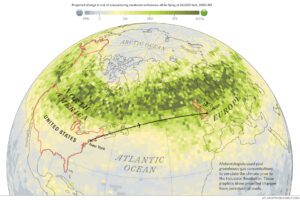
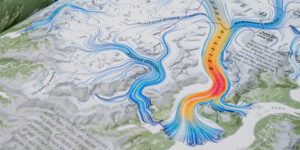
Changes in velocity
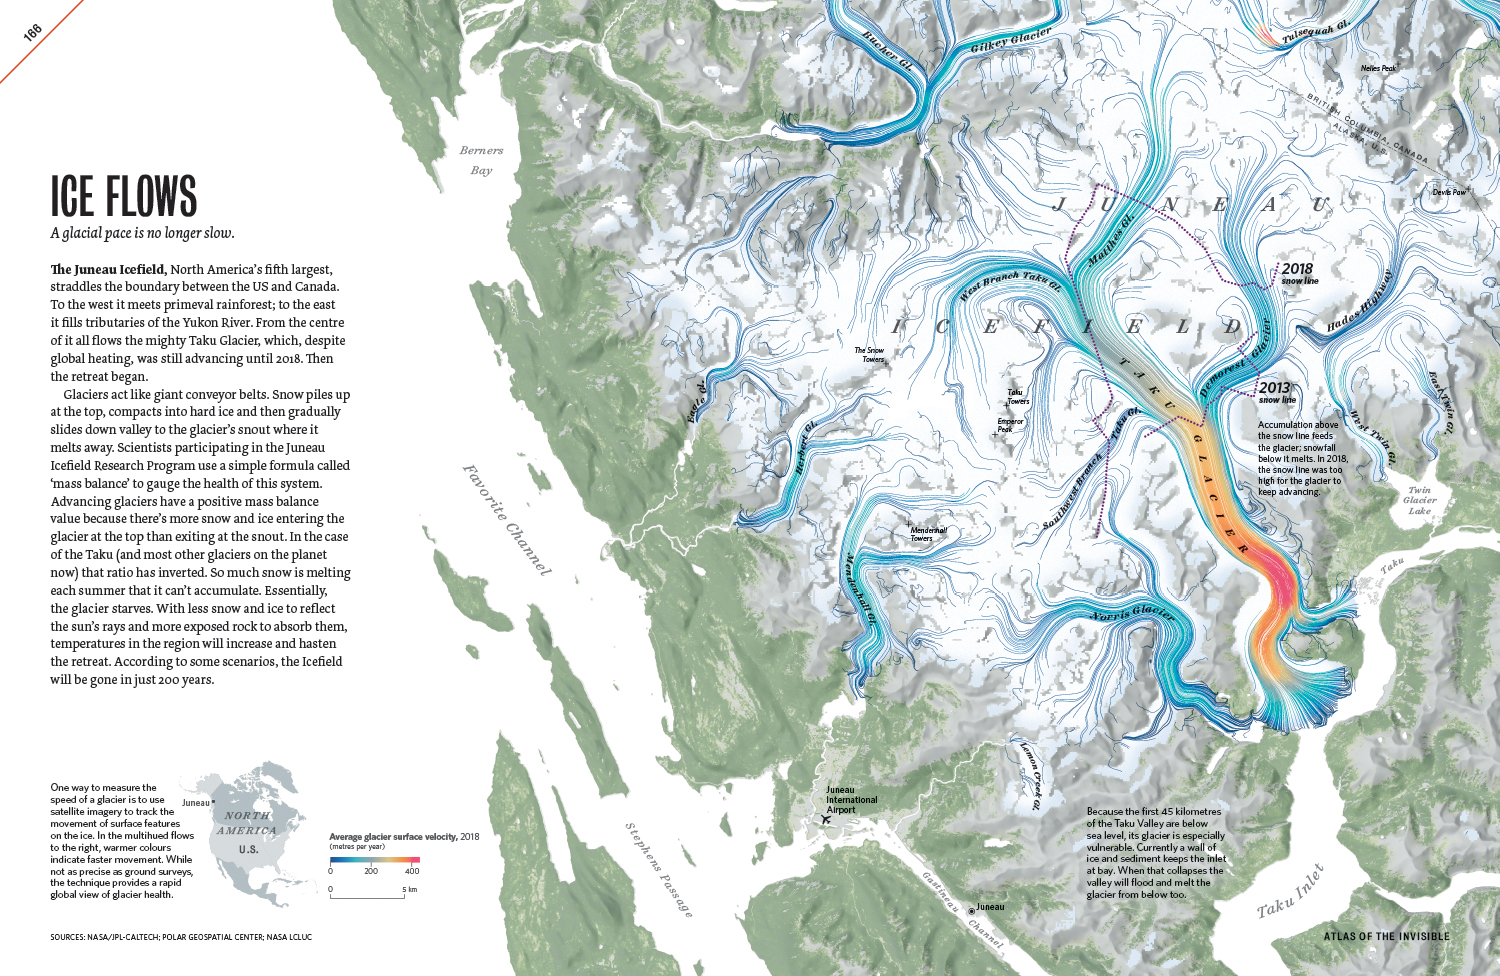
Look at the graphic showing ice flows in the Juneau Icefield. As the text explains
‘One way to measure the speed of a glacier is to use satellite imagery to track the movement of surface features on the ice. In the multihued flows [on the graphic], warmer colours indicate faster movement… the technique provides a rapid global view of glacier health.‘
The graphic also shows how the position of the snow line changed from 2013 to 2018. Describe the location of the glacial ice which has increased most in terms of velocity.
How could this be linked to the changes in the snow line between 2013 and 2018?
The text also explains:
‘Because the first 45 kilometres of the Taku Valley are below sea level, its glacier is especially vulnerable. Currently, a wall of ice and sediment keeps the inlet at bay. When that collapses the valley will flood and melt the glacier from below too.‘
How could this flooding affect:
The Taku Glacier?
The coastal landscape?
Local ecosystems?
The wider area?
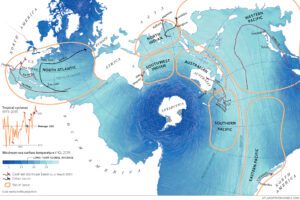
Greenland
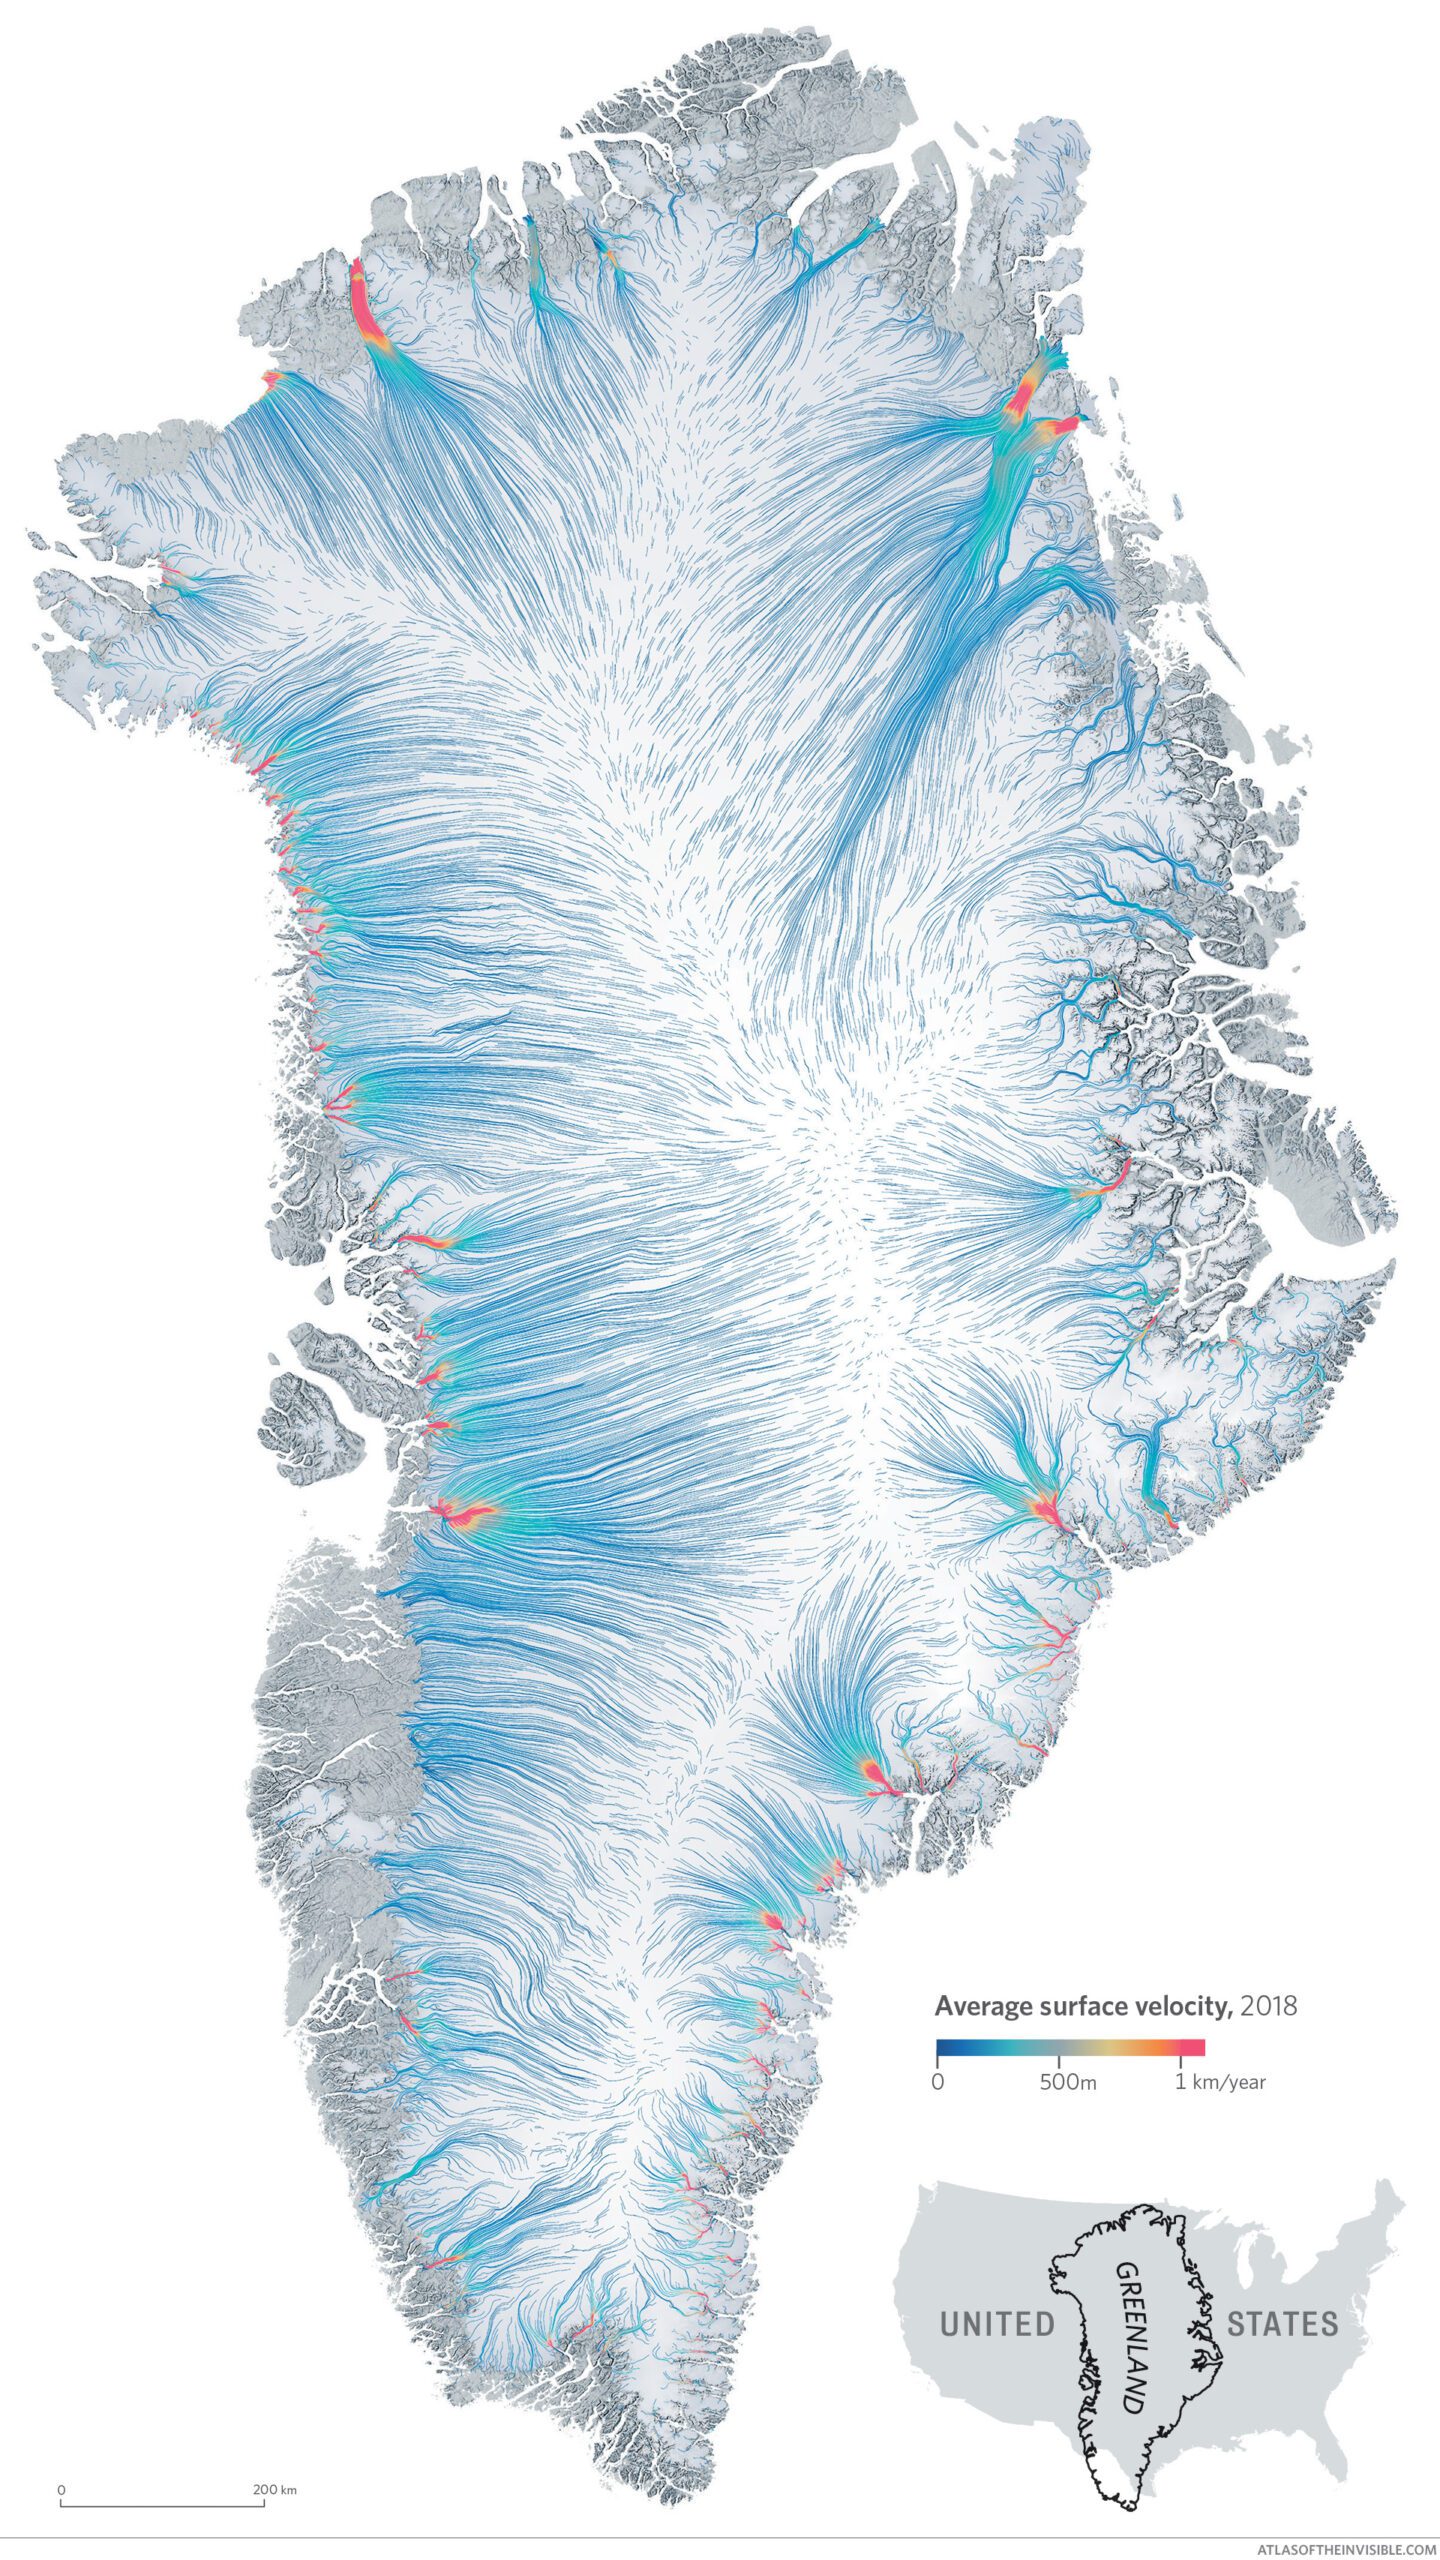
Look at the first Ice Flows map which shows the Juneau Icefield in North America, then take a look at the second Ice Flows map, which focuses on the huge island of Greenland.
‘Beneath a dome of snow and ice, glaciers drain from a central ridge. Winding valleys in the east slow their speeds, whereas heavier snowfall in the northwest supercharges a straight run out to sea.’
As with the first map, warmer colours represent higher average surface velocities for glaciers. Look at the Ice Flows map of Greenland
Can you see the winding valleys and slower glaciers in the east?
Can you see the supercharged glaciers flowing rapidly in the northwest?
‘While the loss of the Juneau Icefield will have little effect on the world’s sea levels, the loss of Greenland’s ice sheet would be catastrophic. Sea levels would rise seven metres and submerge entire nations’.
‘Alas, the big melt is already underway. Greenland lost another 600 gigatons of ice in 2019, leaving it with about 5000 gigatons less than it had 20 years ago. Part of the problem is that once melting starts it is hard to stop. Pools of warm meltwater eventually seep into the glacier. This softens and lubricates its base, speeding its slide to warmer elevations where the ice softens further and slides even faster.’

Look at this graph showing Greenland mass variation in gigatons. Describe the change in the mass of ice from March 2002-May 2020. You may like to think about TEA when you do this:
- Trend
- Evidence (state figures and dates)
- Anomalies
Why is it hard to stop this melting once it starts?
Why is this melting a significant problem at different scales (i.e. local, national and global)?
To find out more about this issue read this article.