Skip to content
James Cheshire
About
Blog
Teaching
Papers
Author:
James Cheshire
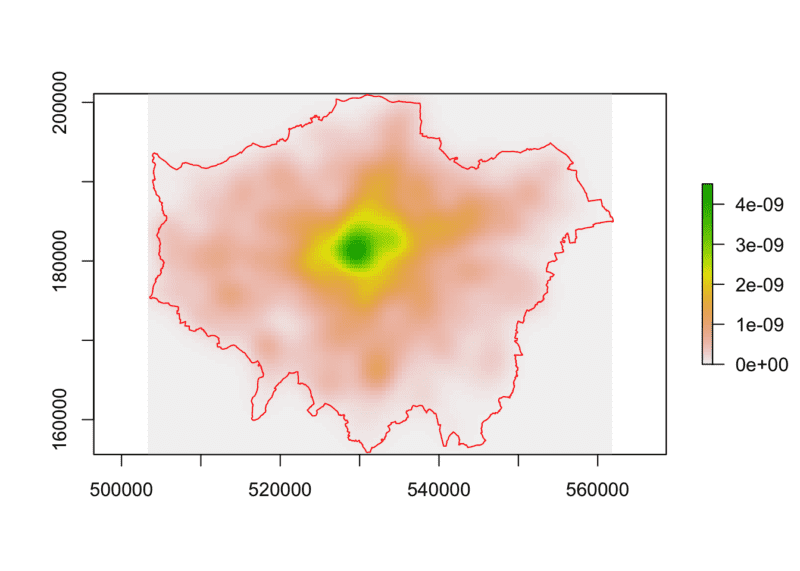
Point Pattern Analysis using Ecological Methods in R
Dec 12, 2017
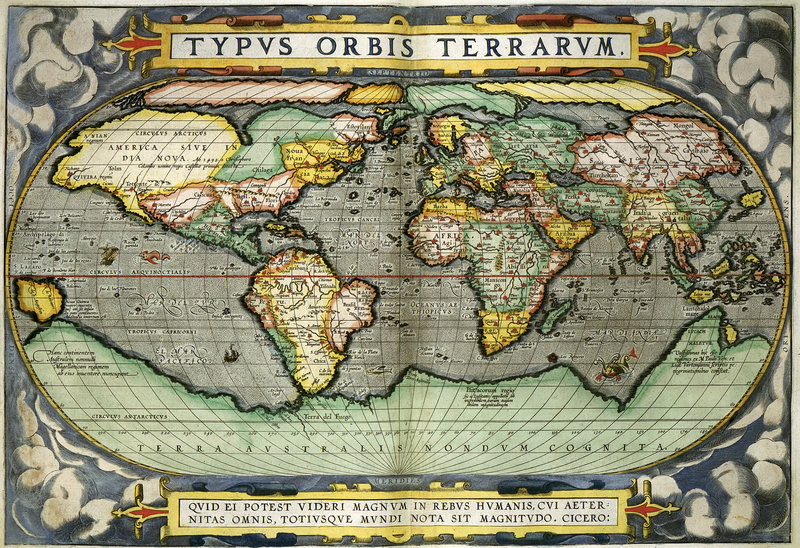
The Ultimate Gift List for Map Lovers
Nov 18, 2017
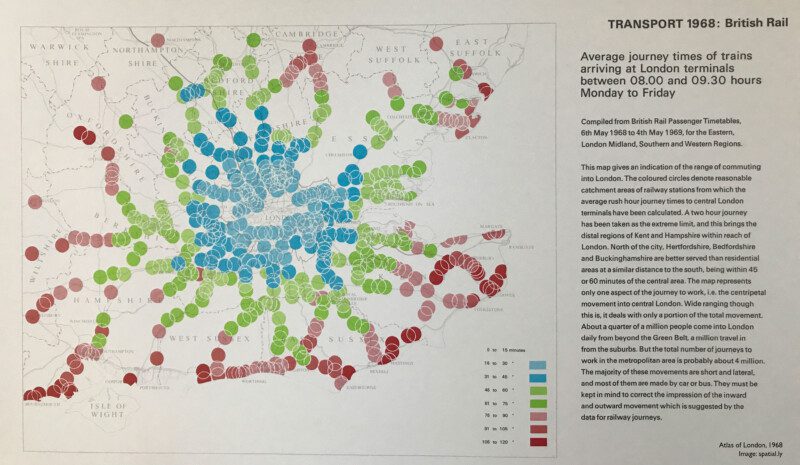
Average Journey Times of Trains into London in 1968
Nov 17, 2017
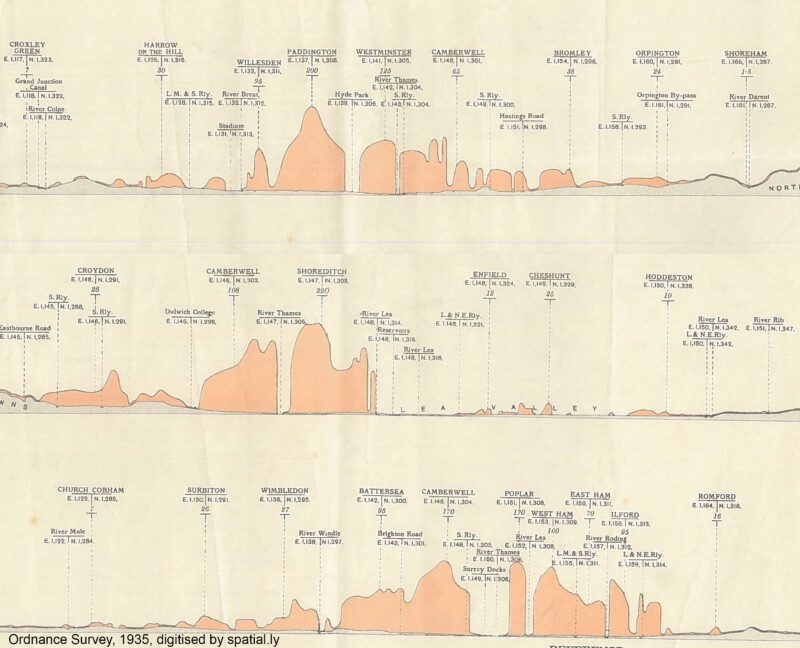
London's Population Profile in 1935
Nov 10, 2017
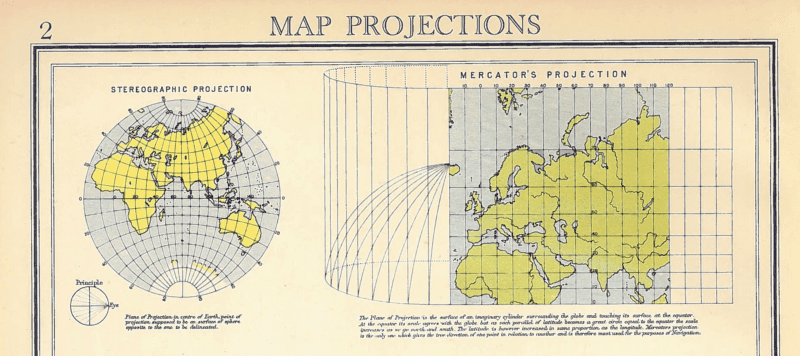
Map Projections
Oct 30, 2017
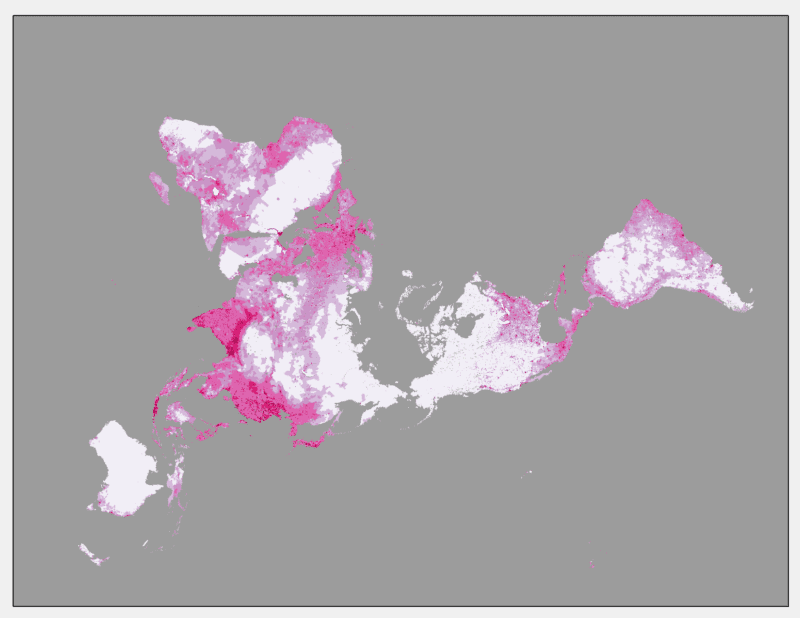
World Population Density 1970-2000
Oct 25, 2017
Google Talks: Where the Animals Go
Oct 6, 2017
Less is More: Data Visualisations for Big Data
Aug 10, 2017
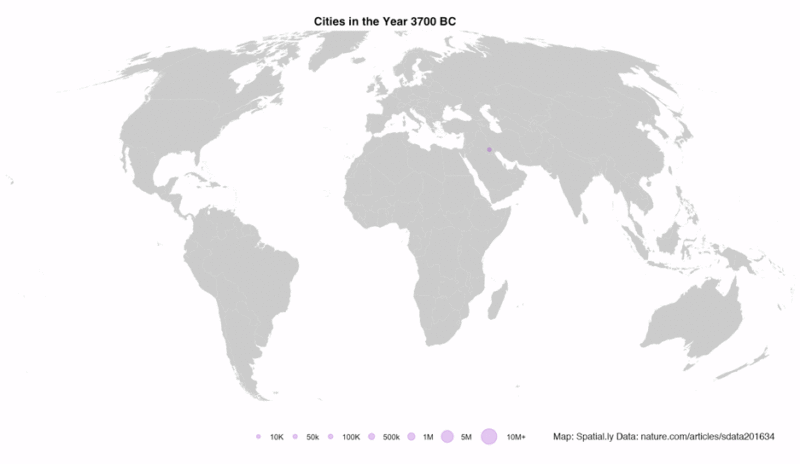
Mapped: 5,000 Years of City Growth
Aug 8, 2017
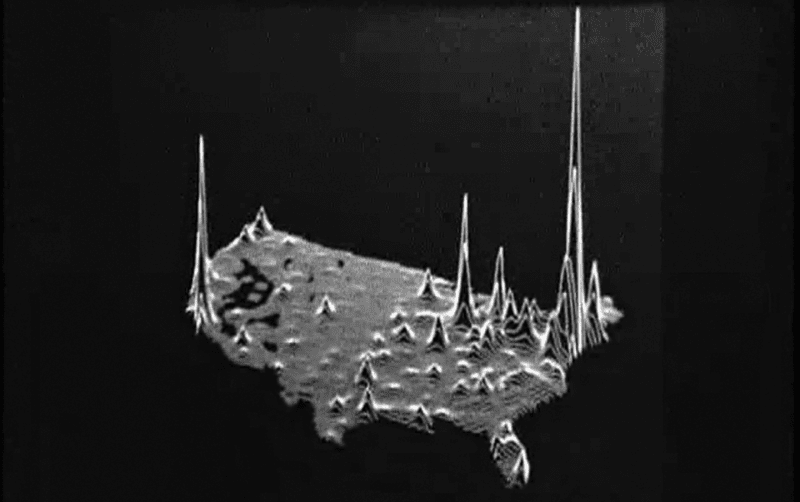
Joy Division, Population Surfaces and Pioneering Electronic Cartography
Jul 28, 2017
Previous Page
1
2
3
4
5
6
…
13
Next Page