The Power of Print
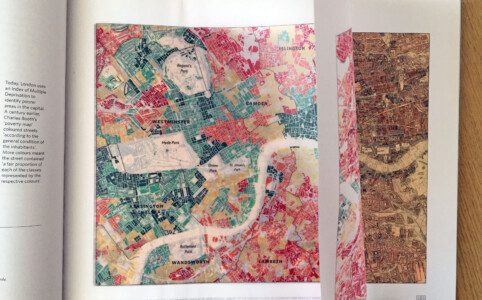
Cross-posted from London: The Information Capital’s website London’s maps are special. They were drawn by pioneers such as Charles Booth, who revealed the full ...
Cross-posted from London: The Information Capital’s website London’s maps are special. They were drawn by pioneers such as Charles Booth, who revealed the full ...
*Cross-posted from London: The Information Capital’s website* As London: The Information Capital enters its second year in print, we think its maps and gr...
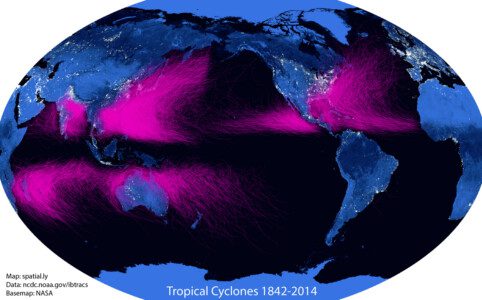
More and more I stumble across really cool datasets online that are crying out to be mapped, but I never seem to have the time to do anything fun with them. I h...
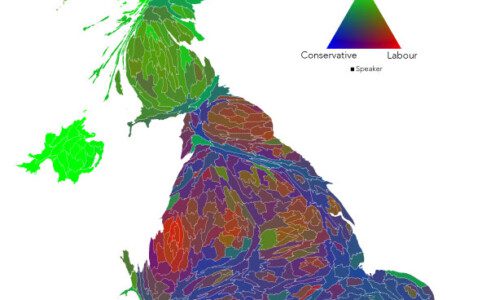
There have been many great interactive maps and graphics produced for the 2015 General Election. A map I haven’t seen though is one that attempts to show ...
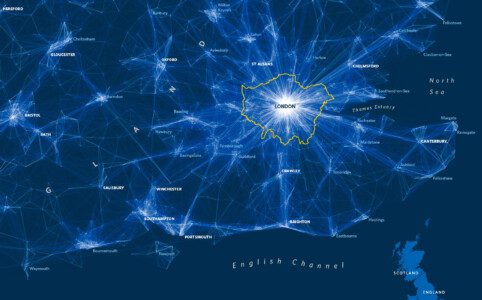
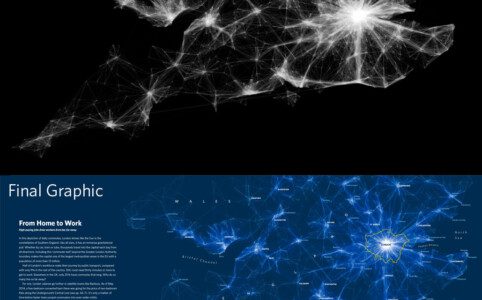
Last year I published the above graphic, which then got converted into the below for the book London: The Information Capital. I have had many requests for the ...
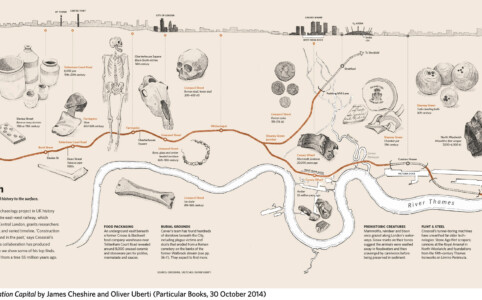
This has been cross-posted from a guest blog post I wrote on the London Datastore. Throughout London’s history, its data have inspired innovative maps and visua...
When I start an R class, one of my opening lines is nearly always that the software is now used by the likes of the New York Times graphics department or Facebo...
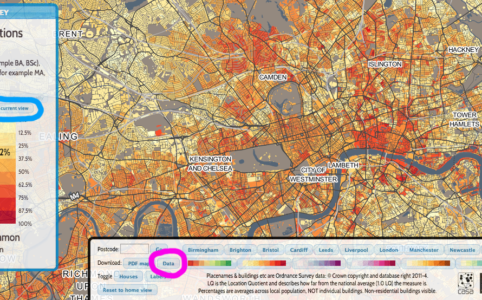
Back in June Oliver O’Brien and I launched an interactive census map called DataShine. It has been hugely successful with a core of regular users in addit...
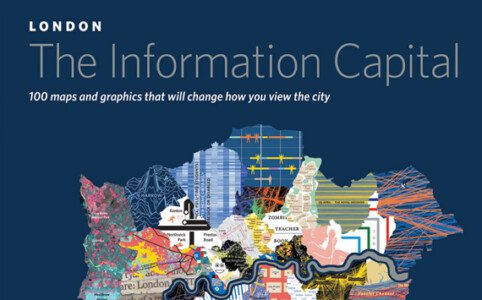
I am pleased announce that London: The Information Capital will be published on the 30th October. It is a book bursting with maps and graphics about the world&#...
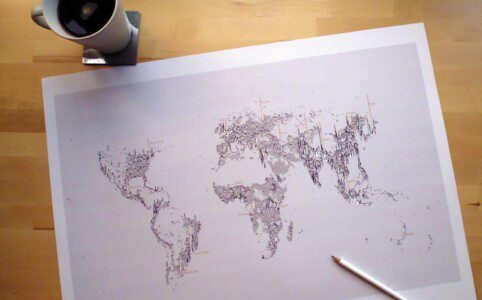
Unfortunately the print is no longer available I recently produced a map entitled “Population Lines”, which shows population density by latitude. Th...