Skip to content
James Cheshire
About
Blog
Teaching
Papers
Category:
Visualisation
Joy Division, Population Surfaces and Pioneering Electronic Cartography
Jul 28, 2017
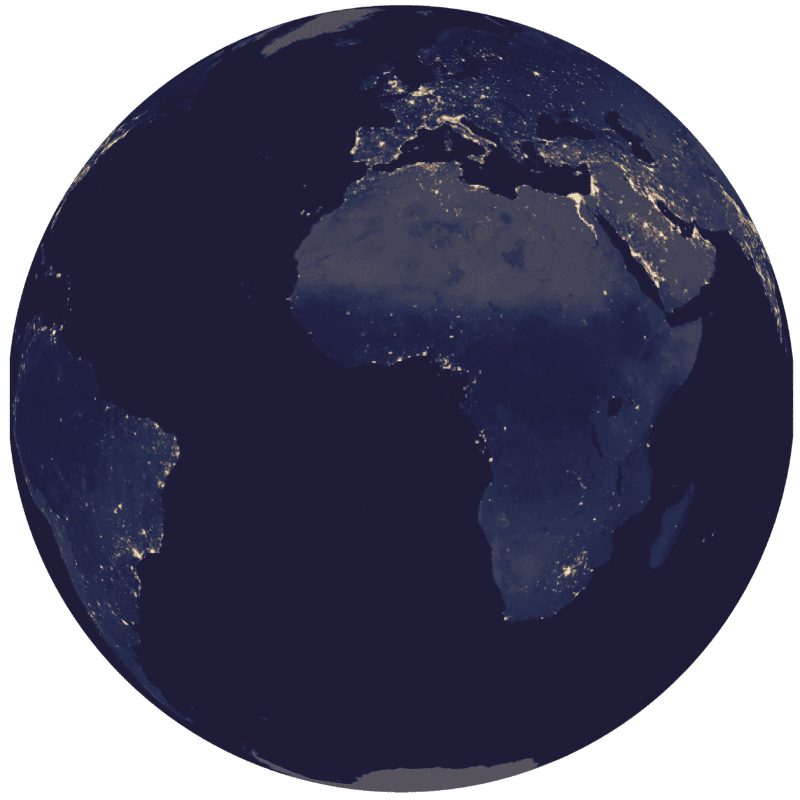
Spinning Globes With R
May 16, 2017
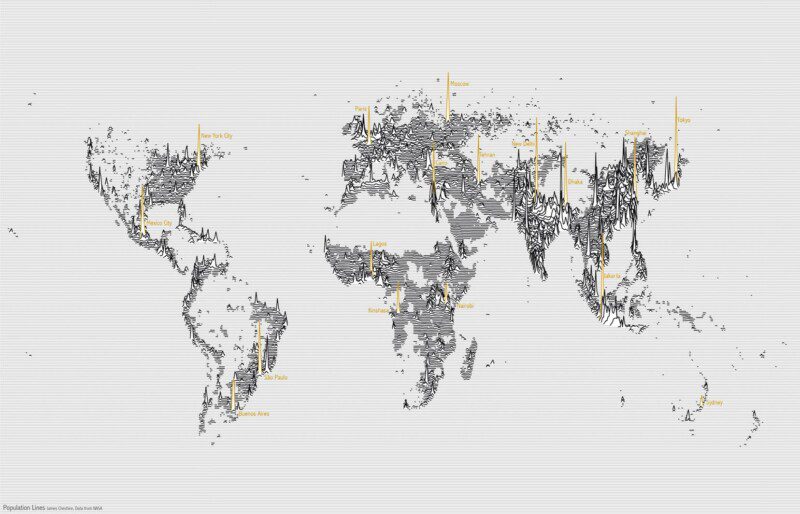
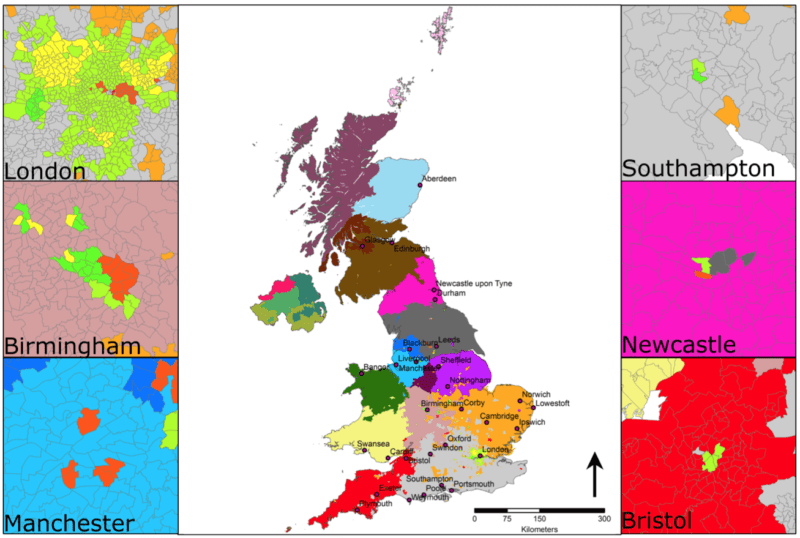
Population Lines: How and Why I Created It
Apr 27, 2017
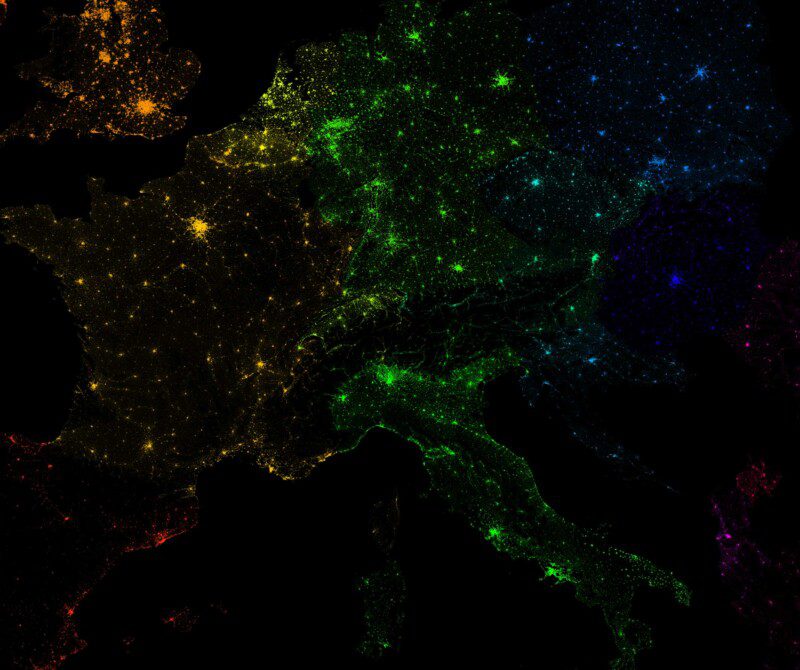
10 Million Dots: Mapping European Population
Mar 23, 2017
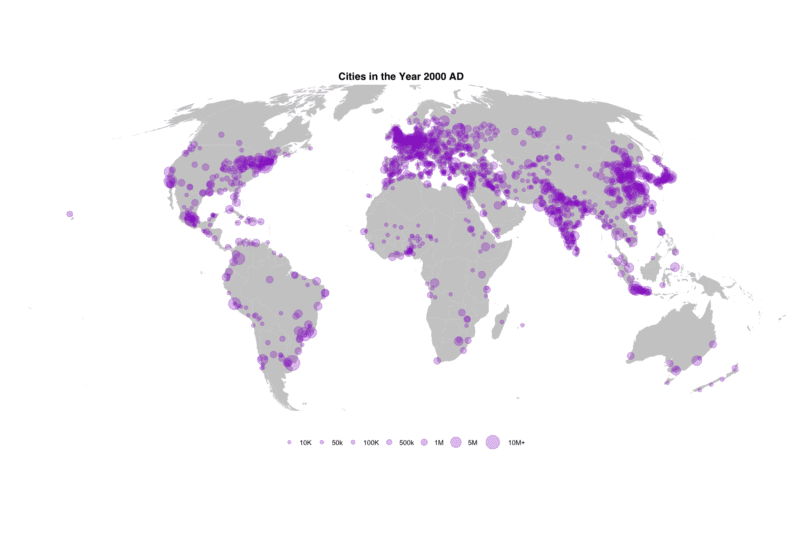
Mapping 5,000 Years of City Growth
Mar 6, 2017
Big Data and Design
Feb 28, 2017
Edward Stanford Award for Innovation in Travel Publishing
Feb 6, 2017
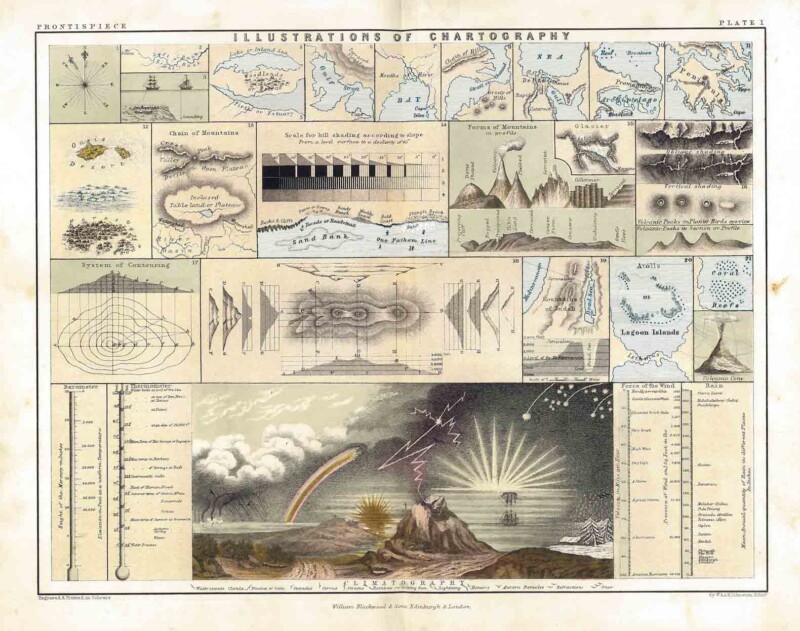
Illustrations of Chartography
Jan 23, 2017
7 Deadly Sins of (Academic) Data Visualisation
Oct 11, 2016
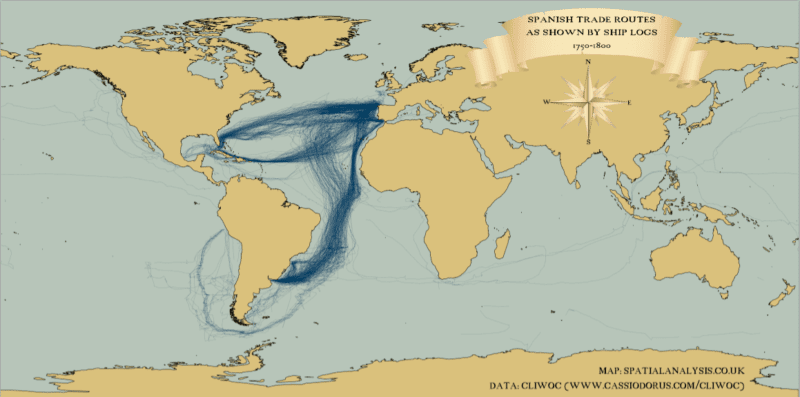
Mapping (historic) tracks in ggplot2
Oct 10, 2016
Previous Page
1
2
3
4
5
…
9
Next Page