
Mapped: Twitter Languages in London
[zoomit id=”IIY6″ width=”auto” height=”400px”] **Update: You can see a new fully-interactive version here** Last year...
[zoomit id=”IIY6″ width=”auto” height=”400px”] **Update: You can see a new fully-interactive version here** Last year...
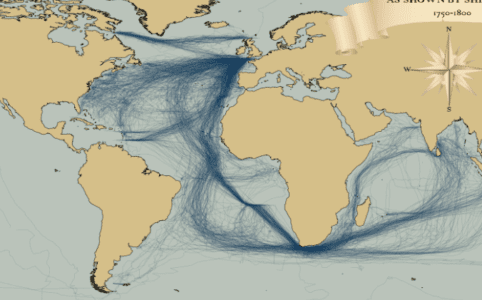
I recently stumbled upon a fascinating dataset which contains digitised information from the log books of ships (mostly from Britain, France, Spain and The Neth...
Last week I attended the Association of American Geographers Annual Conference and heard a talk by Robert Groves, Director of the US Census Burea...
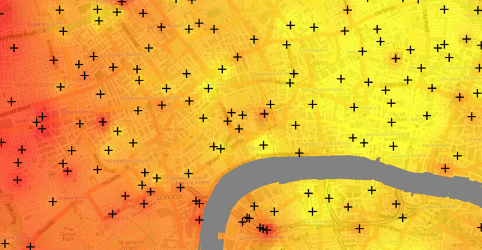
Finding ways to effectively map population data is a big issue in spatial data visualization. The standard practice uses choropleth maps that simply col...
It would be a shame to end the year without a festive map! Jack Harrison (@jacksfeed) is studying for a research masters in “Advanced Spatial Analysis and...
As 2011 draws to a close it is worth reflecting on what, I think, has been a defining year for mapping and spatial analysis. Geographic data have become open, b...
Another day, another Twitter map- this time showing the global distribution of tweets that link to academic journal articles. I am always a bit skeptical of Twi...
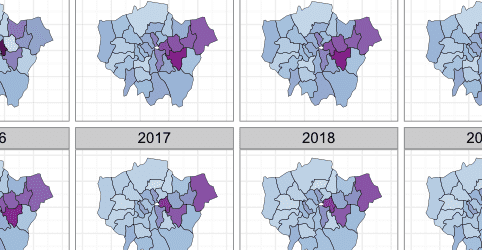
Buried in the London Datastore are the population estimates for each of the London Boroughs between 2001 – 2030. They predict a declining population for m...
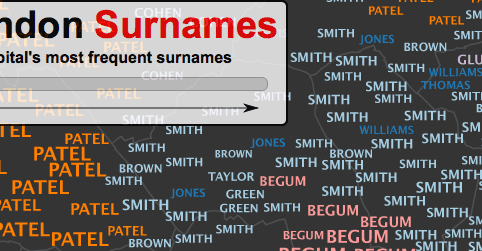
Inspired by the What’s in a Surname? map we helped make with the National Geographic, I have created 15 interactive typographic maps to show the most popu...
The visualisation above shows the average relative duration of Boris Bikers’ weekday journeys over a 4 month period at hourly intervals. For each time ste...