Week 8 Solution: GWR Interpretation
Write a 350 word summary of the analysis you have conducted. Comment on the value of GWR in this context and suggest additional methods that may also be appropriate.
When addressing this task, it is important to think about what the key takeaways are for your readers. In general, they want to know:
- The question you are trying to answer/ problem you are trying to solve.
- The approach you have taken to solve it.
- What the outcomes are.
- What is the interpretation/ significance of these outcomes?
- Any areas that might be improved upon.
So in the context of the GWR task we might break it down as below. You may have opted for a different question or emphasis and that’s fine, it’s just important to ensure the details we need are there to justify, articulate and validate your analysis. You do not need to replicate these subheadings each time, but I have included them for clarity. Finally, you should be more precise than I am in terms of reporting specific values etc for the model outputs.
- Question:
Is there a relationship between ethnicity, qualifications and unemployment in the London borough of Camden? Does it vary or remain consistent across the borough?
2. Approach
In the first step of this analysis an OLS regression was undertaken to establish what, if any, relationship exists between our two explanatory variables – % White British & % Unemployed – with our outcome variable – % with qualification. The resulting model has an adjusted R-squared value of 0.463. So it can be assumed that 46% of the variance can be explained by the model.
However, there may be some variation in the coefficients across space as some parts of the borough exhibit different socioeconomic characteristics to others. In order to explore this in more detail, geographically weighted regression (GWR) was undertaken [for reports you should provide references and more explanation here].
Due to the different size and density of the input spatial units to the analysis – in this case Output Areas – an adaptive gaussian bandwidth was chosen and implemented with the gwr.sel function [again you can insert more detail here if space permits].
3. Outcomes

The figure above shows the distribution of the two explanatory variables and their respective impacts on the outcome variable. In the case of the White British variable the implied relationship is positive, whilst there is a negative relationship between the % people unemployed and the % with a qualification. These relationships are not uniform across Camden with output areas to the east being more positively impacted for White British, and those to the north and south-west exhibiting a greater impact of unemployment on qualifications. The R-squared values are mapped below, suggesting that some areas of Camden have a very weak relationship between the variables.
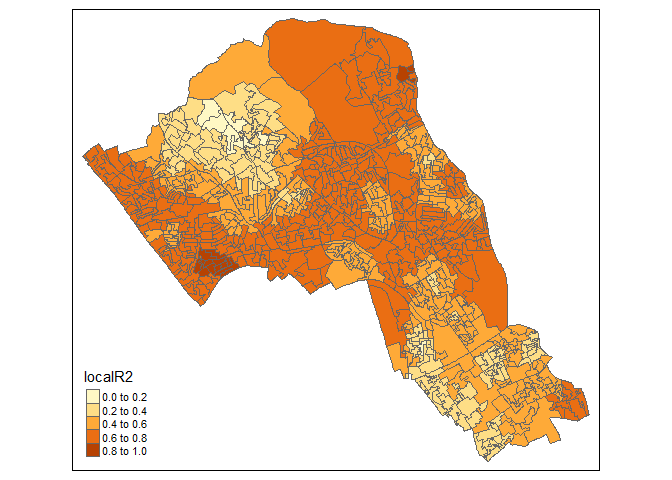
4. Interpretation
In this section it is your opportunity to reflect on the value of the analysis and what it might actually mean. Can the variations in R-squared be explained? Should some areas of the map be excluded/ discounted as a result of their low values? What are the policy implications or interventions? Could unemployment levels be used as a proxy for qualification in Camden? Are there likely to be other factors at play?
5. Improvements
If you chose not to address it above, you could discuss the impacts of multicollinearity or poor model specification. You might also propose other methods or approaches? Offer a concluding statement about the value of GWR in this context.