Mapping GCSE Scores
In the UK, August is exam results month for 16-18 year olds. Every year, photos of leaping teenagers clutching their results are accompanied by reports of recor...
In the UK, August is exam results month for 16-18 year olds. Every year, photos of leaping teenagers clutching their results are accompanied by reports of recor...
The Guardian have been keeping track of the magistrate cases and convictions resulting from the recent rioting in England. Using this data I have produced the &...
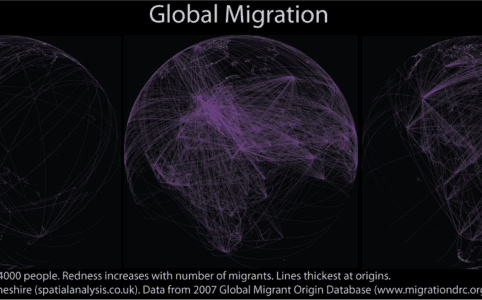
Migrations of people have existed for millennia and occur at a range of scales and time-periods (from small-scale journeys to work through to intercontinental ...
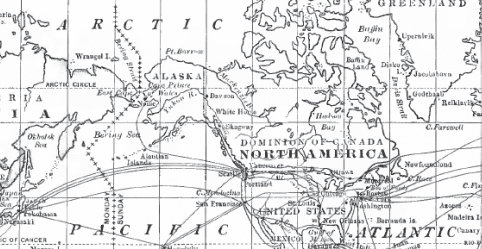
Flattening the Earth so that it can be easily drawn on a 2-dimensional surface is complicated. Over many years map projections have been developed to aid in thi...
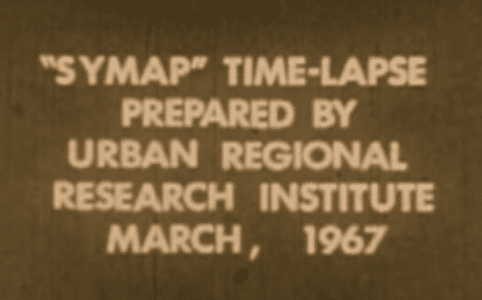
I hadn’t seen this video before. It demonstrates one of the earliest attempts at automated cartography for the display of time with spatial data. Truly gr...
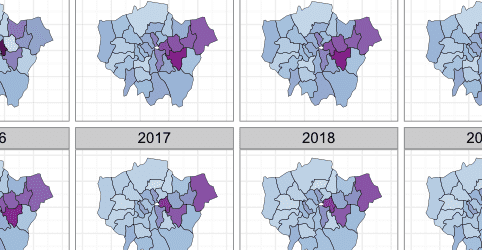
Buried in the London Datastore are the population estimates for each of the London Boroughs between 2001 – 2030. They predict a declining population for m...
The release of the R package “googleVis” has made the production of interactive maps through Google’s Chart Tools a simple task. Ignoring the some basic d...

Some of us at CASA can’t get enough of the Barclay’s Cycle Hire data. We have had Ollie‘s hugely successful flow maps, journey time heat maps,...
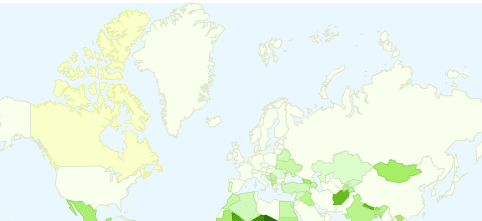
Using the release of the "Muslim Populations By Country" dataset from the Guardian Datastore I have produced a cartogram to visualise the data. The size of the ...