Skip to content
James Cheshire
About
Blog
Teaching
Papers
Author:
James Cheshire
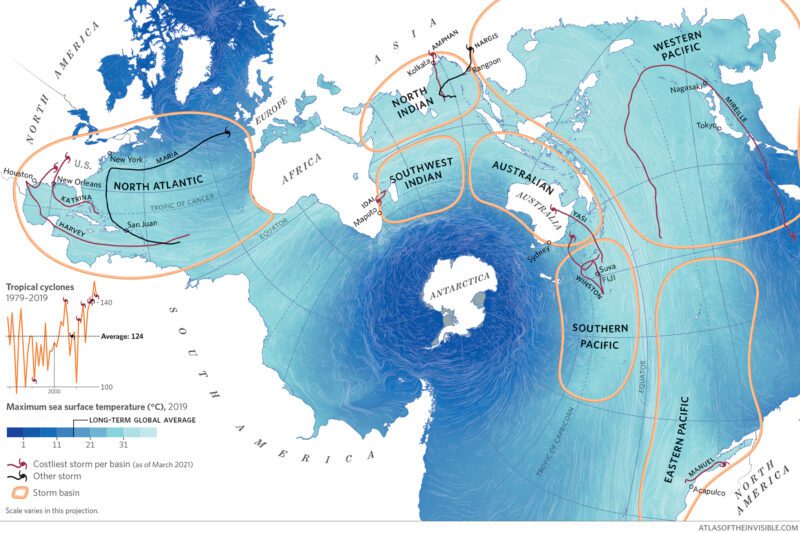
Anxiety and Mapping the Climate Crisis
Jan 18, 2022
If Data Could Talk Podcast
Jan 18, 2022
Being creative is reason enough to try different data visualization
Jan 7, 2022
The contested borders on my Christmas tree
Dec 29, 2021
Antarctica Ice Flows
Dec 18, 2021
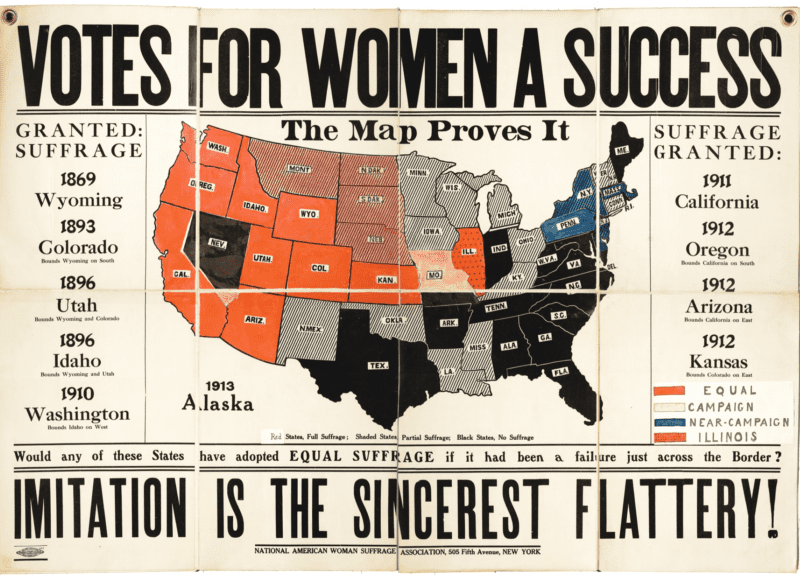
What maps made by 20th century suffragists can teach us about holding leaders to account on climate change
Nov 30, 2021
Science and Cocktails: Maps of the Invisible
Nov 14, 2021
Failure is part of the visualization process
Nov 4, 2021
How clean is the air we breathe?
Nov 2, 2021
Do you suffer from flygskam [flight shame]?
Sep 29, 2021
Previous Page
1
2
3
4
…
13
Next Page


![Do you suffer from flygskam [flight shame]?](https://jcheshire.com/wp-content/uploads/2021/08/Guardian_01_Carbon-Overhead-800x533.jpg)