Skip to content
James Cheshire
About
Blog
Teaching
Papers
Tag:
R
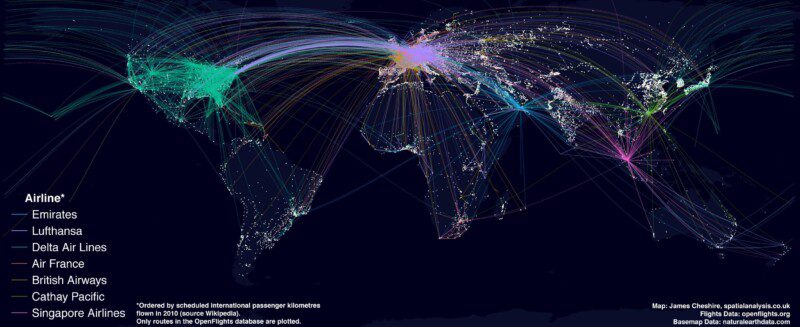
Mapping the World's Biggest Airlines
Jun 7, 2012
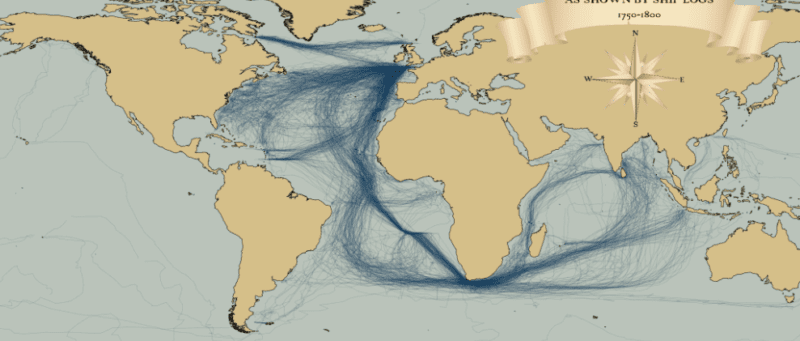
Mapped: British, Spanish and Dutch Shipping 1750-1800
Mar 30, 2012
Great Maps with ggplot2
Feb 2, 2012
Coming of Age: R and Spatial Data Visualisation
Jan 10, 2012
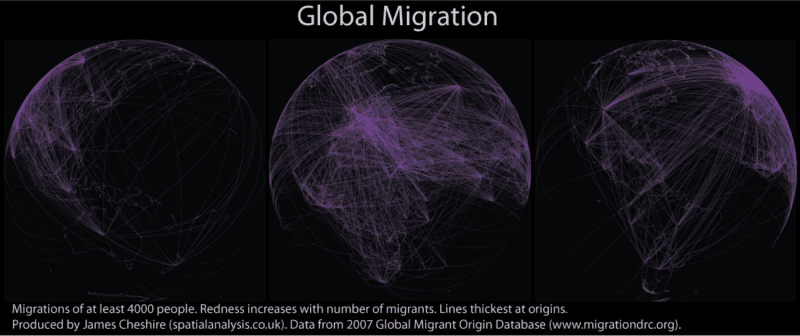
Global Migration Maps
Mar 17, 2011
Mapping London's Population Change 1801-2030
Feb 16, 2011
R interface to Google Chart Tools
Jan 10, 2011
Boris Bikes/Barclays Cycle Hire Average Journey Times
Jan 7, 2011
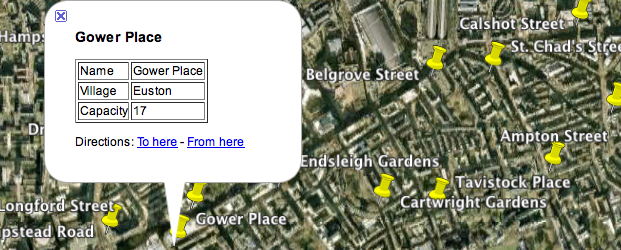
Exporting KML from R
Jan 3, 2011
Previous Page
1
2